EuCham – European Chamber lists the European countries according to the migration rates based on the data published by the Central Intelligence Agency (CIA). The rate considers immigrants and emigrants, defined as individuals moving to a country to which they are not native for purposes of permanent residency or future citizenship. It is positive if more people enter the country or negative if more people leave
Download PDF – Startup Nation Article
|
EuCham Research Migration rates in Europe (‰)
Central Intelligence Agency data, 2014 |
Source: eucham.eu/research |
Detailed Information
EuCham – European Chamber lists the European countries according to the migration rates based on the data published by the Central Intelligence Agency (CIA). The rate considers immigrants and emigrants, defined as individuals moving to a country to which they are not native for purposes of permanent residency or future citizenship. It is positive if more people enter the country or negative if more people leave
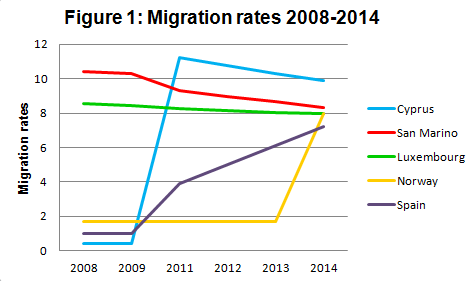
Cyprus, which offers a fast-track citizenship program, is ranked top with a positive migration rate of 9.89‰, while other countries including Hungary, Austria and Spain offer a fast-residency scheme. The Cypriot program offers citizenship and passport in 3 months to big investors without requesting them to live there at any point in time. The countries following in the top 5 are San Marino, Luxembourg, Norway and Spain. Europe has on average positive migration rates, with the only exception of the Balkan and Baltic regions which occupy positions #32-47. At the bottom of the table there are Armenia and Moldova, which faces the most severe migration outflows in Europe with -9.8‰.
As it can be inferred by Figure 1 (rates in ‰), Cyprus and Spain have faced steep increases in immigration from 2009, notwithstanding the effects of the economic crisis which more heavily hit the South of Europe. Norway is experiencing increasing immigration due to high standards of living and stable and favourable economic conditions.
Methodology
The migration rate is the difference between immigrants and emigrants of an area in a specific period of time, divided per 1,000 inhabitants. A positive value represents more people entering the country than leaving it, while a negative value means more people leaving than entering it.
Figure 1 has been created based on the values in the database of statistiques-mondiales.com. Data were considered from 2008 to 2014 with the only exception of 2010 (no data available).
Business focus: Effects of immigration
Migration has overflowed the political and economic debate over the past decades as the globalization of the job markets expands. However, its benefits, costs, issues and advantages are generally overlooked from a business perspective.
Undoubtedly, immigration has proven to be highly beneficial for businesses and for SMEs. Yet, a lack of governmental intervention on a global and national scale cause the frequent occurrence of some issues, of which illegal immigration is the most severe. It puts businesses at risk and make ethical enterprises be outcompeted by unethical organization, which can benefit by hiring illegal immigrants at lower costs thus unfairly providing cheaper services. Other issues include the difficulty to assimilate immigrants into the work culture and language barriers.
When considering a global expansion, countries with high immigration may be preferred due to their favourable conditions such as the provision of language and cultural knowledge that current staff might not possess. Moreover, the diversification of the workforce might foster innovation and protect from anti-discrimination laws.
Furthermore, skilled immigrants represent an under-tapped talent pool of highly flexible, adaptable and loyal workers, ideal for expanding businesses. Unskilled immigration can also be beneficial for the national economy and enterprises, by providing a steady supply of candidates to fill job openings often neglected by native people.
EuCham – European Chamber listed the European countries according to the migration rates, which indicates the difference between immigrants and emigrants of a country in a given year per 1,000 persons, based on data from Central Intelligence Agency (2014). As seen here by these metrics, SMEs could take advantage of the high migration inflows occurring in Cyprus, Luxembourg, Norway which by providing advantageous tax and bureaucratic laws attracting with immigration a stream of inflow capital which can ultimately stimulate the economy.
Table 1: Immigration rates (‰) in Europe
|
Rank |
Country |
Immigration rate |
|
1 |
Cyprus |
9.89 |
|
2 |
San Marino |
8.31 |
|
3 |
Luxembourg |
7.97 |
|
4 |
Norway |
7.96 |
|
5 |
Spain |
7.24 |
|
6 |
Sweden |
5.46 |
|
7 |
Switzerland |
5.43 |
|
8 |
Liechtenstein |
4.72 |
|
9 |
Italy |
4.29 |
|
10 |
Ireland |
3.31 |
|
11 |
Monaco |
2.85 |
|
12 |
Portugal |
2.74 |
|
13 |
United Kingdom |
2.56 |
|
14 |
Greece |
2.32 |
|
15 |
Denmark |
2.25 |
|
16 |
Czech Republic |
2.15 |
|
17 |
Malta |
1.99 |
|
18 |
Netherlands |
1.97 |
|
19 |
Austria |
1.76 |
|
20 |
Russia |
1.69 |
|
21 |
Croatia |
1.43 |
|
22 |
Hungary |
1.34 |
|
24 |
Belgium |
1.22 |
|
23 |
France |
1.09 |
|
26 |
Germany |
1.06 |
|
25 |
Belarus |
0.78 |
|
27 |
Lithuania |
0.73 |
|
28 |
Finland |
0.62 |
|
29 |
Iceland |
0.52 |
|
30 |
Poland |
0.47 |
|
31 |
Turkey |
0.46 |
|
32 |
Slovenia |
0.37 |
|
33 |
Slovakia |
0.01 |
|
34 |
Ukraine |
-0.06 |
|
35 |
Romania |
-0.24 |
|
36 |
Bosnia & Herzegovina |
-0.37 |
|
37 |
Macedonia |
-0.48 |
|
39 |
Latvia |
-2.37 |
|
41 |
Bulgaria |
-2.89 |
|
42 |
Georgia |
-3.25 |
|
43 |
Albania |
-3.31 |
|
45 |
Estonia |
-3.37 |
|
46 |
Armenia |
-5.88 |
|
47 |
Moldova |
-9.8 |
Sources: Central Intelligence Agency (2014)
EuCham Research Department – Compiled by Mr Henni Biskri and Mr Luca Nazzicone 2015-01-25