Government debt or ‘public debt’ is defined as the total amount of money owed by the government to creditors. After the financial crisis, which began in the late 2007, European countries highly increased their percentage of government debt.
Currently, Greece has the highest government debt to GDP ratio of 174%, which led the country to debt crisis and a possibility of default. In a five year period, the country has been lent an astonishing amount of money in not just one but two bailouts, resulting in $275 billion, worth more than the country’s entire economic output. Following Greece are Italy (2nd), Cyprus (3rd) and Belgium (4th) whose high public debt may reduce their long-run growth and may partly negate the positive effects of the fiscal stimulus.
|
EuCham Charts
EuCham data based on “The World Bank report” |

Source: eucham.eu/charts |
Detailed Information
Government debt or ‘public debt’ is defined as the total amount of money owed by the government to creditors. After the financial crisis, which began in the late 2007, European countries highly increased their percentage of government debt. Decreased tax revenues, recapitalisation of banks and simultaneous massive economic programs influenced the increase in public debt and resulted in different outcomes, described below.
European countries which took high advantage of these positive conditions for raising government debt found themselves in a particularly dangerous trajectory of ineptness in recent years. As a result, instead of improving their economic positions, this led to negative consequences, such as reduction in long-run economic growth.
Currently, Greece has the highest government debt to GDP ratio of 174%, which led the country to debt crisis and a possibility of default. In a five year period, the country has been lent an astonishing amount of money in not just one but two bailouts, resulting in $275 billion, worth more than the country’s entire economic output. Following Greece are Italy (2nd), Cyprus (3rd) and Belgium (4th) whose high public debt may reduce their long-run growth and may partly negate the positive effects of the fiscal stimulus.
Contrary to the countries with high government debt to GDP ratio, Estonia and Switzerland have successfully managed their finances, meaning that their governments maintain their internal funds sufficiently, ensuing the ability to repay their debt without issuing high amount of further national debt. However, Russia possesses an uncommon case in which the government debt to GDP ratio of 12% is relatively low. Russia defaulted in 1988 because the markets were not willing to offer them attractive loans and thus, they were forced to use alternative funding sources such as gaining large trade surplus from rise in oil prices.
In conclusion, it can be seen that between 2009 and 2014, the government debt to GDP ratio has increased in all countries, with the only exceptions being Norway and Turkey. Unfortunately, many countries need to be reminded on the line limit- a line which may result in economic destabilisation and reduction of the growth in the long-run.
Methodology
The data for the countries are collected from the World Bank report from years 2009 and 2014 respectively. Government debt to GDP ratio represents the gross amount of government liabilities reduced by the amount of equity and financial derivatives held by the government. For measuring the government debt to GDP ratio, the central government debt, total % of GDP indicator was used.
Map 1: Government debt to GDP ratio

Figure 1: Increase in government debt to GDP ratio
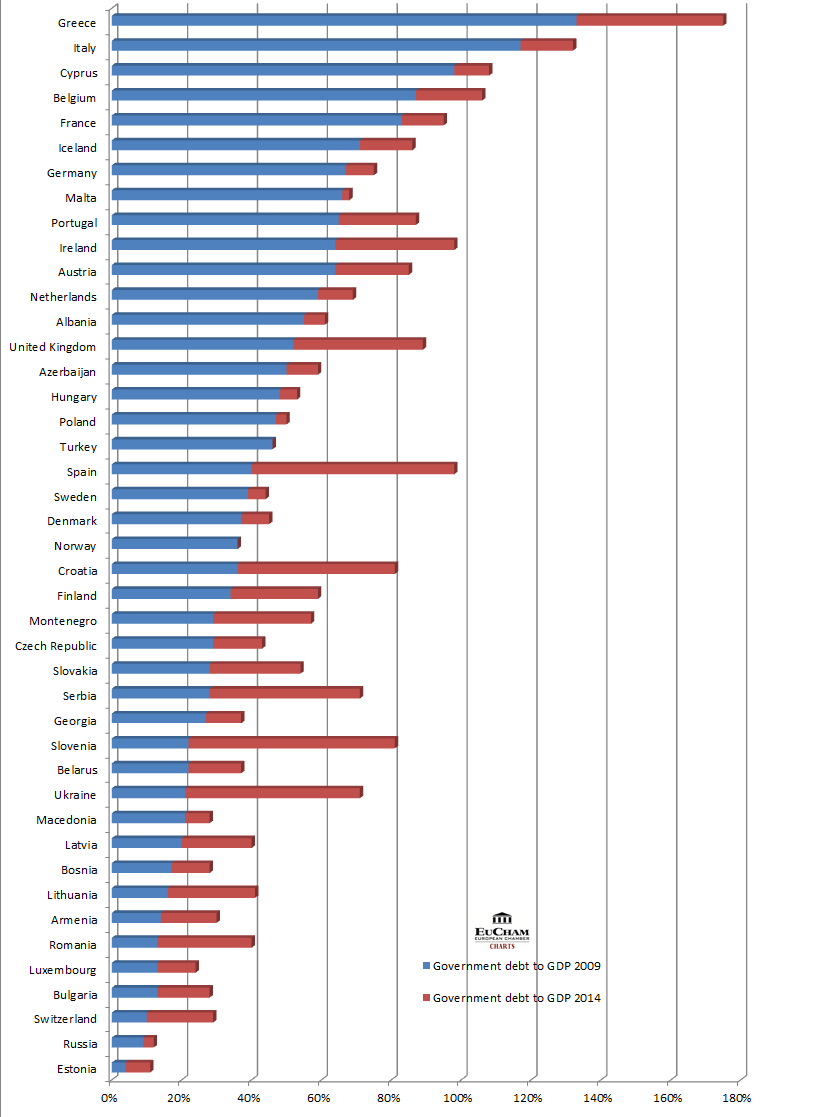
Table 1: Government debt to GDP ratio
|
Rank |
Country |
Government |
Government |
|
1 |
Greece |
133 |
174 |
|
2 |
Italy |
117 |
132 |
|
3 |
Cyprus |
89 |
108 |
|
4 |
Belgium |
87 |
106 |
|
5 |
Spain |
46 |
98 |
|
6 |
Ireland |
67 |
98 |
|
7 |
France |
83 |
95 |
|
8 |
United Kingdom |
69 |
89 |
|
9 |
Portugal |
65 |
87 |
|
10 |
Iceland |
71 |
86 |
|
11 |
Austria |
69 |
85 |
|
12 |
Slovenia |
22 |
81 |
|
13 |
Croatia |
36 |
81 |
|
14 |
Germany |
47 |
75 |
|
15 |
Ukraine |
25 |
71 |
|
16 |
Serbia |
28 |
71 |
|
17 |
Netherlands |
54 |
69 |
|
18 |
Malta |
82 |
68 |
|
19 |
Albania |
55 |
61 |
|
20 |
Finland |
41 |
59 |
|
21 |
Azerbaijan |
50 |
59 |
|
22 |
Montenegro |
29 |
57 |
|
23 |
Slovakia |
28 |
54 |
|
24 |
Hungary |
48 |
53 |
|
25 |
Poland |
47 |
50 |
|
26 |
Denmark |
37 |
45 |
|
27 |
Sweden |
39 |
44 |
|
28 |
Czech Republic |
29 |
43 |
|
29 |
Lithuania |
29 |
41 |
|
30 |
Romania |
13 |
40 |
|
31 |
Latvia |
30 |
40 |
|
32 |
Belarus |
19 |
37 |
|
33 |
Georgia |
27 |
37 |
|
34 |
Turkey |
54 |
33 |
|
35 |
Armenia |
14 |
30 |
|
36 |
Switzerland |
24 |
29 |
|
37 |
Bulgaria |
13 |
28 |
|
38 |
Bosnia |
17 |
28 |
|
39 |
Macedonia |
21 |
28 |
|
40 |
Norway |
36 |
26 |
|
41 |
Luxembourg |
13 |
24 |
|
42 |
Russia |
9 |
12 |
|
43 |
Estonia |
4 |
11 |
No data: Andorra, Kazakhstan, Kosovo, Liechtenstein, Monaco, San Marino
The data has been ranked according to Government debt to GDP 2014
Source: The World Bank
EuCham Research Department – Compiled by Sofija Daceva 2015-07-07