EuCham aims to find the relation between the increasing difference in unemployment level in basic and in advance education. For the sake of better understanding the data, in this study low-skill and high skill intensive sectors will refer to the sectors which mostly employ people with basic education and with advanced education, respectively.
Many economic models suggested that the unemployment gap between low and high skill intensive sectors would decrease over the 21st century. However, acquired data proves expectations wrong.
|
EuCham Research
Average values over 10 years |
Source: eucham.eu/charts |
Detailed Information
EuCham aims to find the relation between the increasing difference in unemployment level in basic and in advance education. For the sake of better understanding the data, in this study low-skill and high skill intensive sectors will refer to the sectors which mostly employ people with basic education and with advanced education, respectively.
Many economic models suggested that the unemployment gap between low and high skill intensive sectors would decrease over the 21st century. However, acquired data proves expectations wrong.
One possible explanation could be the boom of the Information and Communication Technologies (ICT) sector. This phenomenon is known as the Skill Biased Technological Change (SBTC). European countries have undergone a technological revolution which has shifted the demand toward highly educated workers and toward jobs with a greater content of implicit knowledge. More generally, computers are substitutes for workers in the low-skill intensive sectors, while they are complements for the workers in the high-skill intensive sectors. Employees with tertiary (advanced) education now work much faster and more efficiently than before. This increased productivity resulted in higher wages in the high-skill intensive sectors, while the decreasing costs of computers have made laying off workers in the low-skill intensive sectors much cheaper. Workers with basic education level simply cannot satisfy the level of productivity achieved by machines and computers. The unemployment grows at an extreme phase and workers with primary or lower education have less and less bargaining power towards employers. This is a constant and growing problem. As it can be seen from the graphs, the unemployment gap between high-skill and low-skill intensive sectors experienced an exponential growing trend on average over Europe.
The gap has been almost non-existent in Turkey, which remains the only country where the unemployment rate of people who completed tertiary education is higher than the one of people with primary or lower secondary education.
The most extreme difference among all the countries listed is in Slovakia. The great gap between the unemployment rate of high-skilled and low-skilled workers is a more complex result of many different factors. The nature of the persistent unemployment rate is twofold: structural and incentive-based. Structural unemployment arises from the labour market and the low vacancy creation due to inappropriate initial structure of the economy, and also because of the exclusion of low-skilled, uneducated workers and discriminated Roma population. Incentive-based unemployment stems from the low labour demand and from the small difference between the wage in low-skill intensive sectors and unemployment benefits.
Methodology
This EuCham Chart relies on data collected from Eurostat and ILOSTAT. It shows the average difference between unemployment rates based on education level over 10 years from 2004 to 2014.
European countries are listed based on the 10 years average size of the unemployment gap between high and low-skill intensive sectors.
Figure 1: Difference in the unemployment rate between basic and advanced education
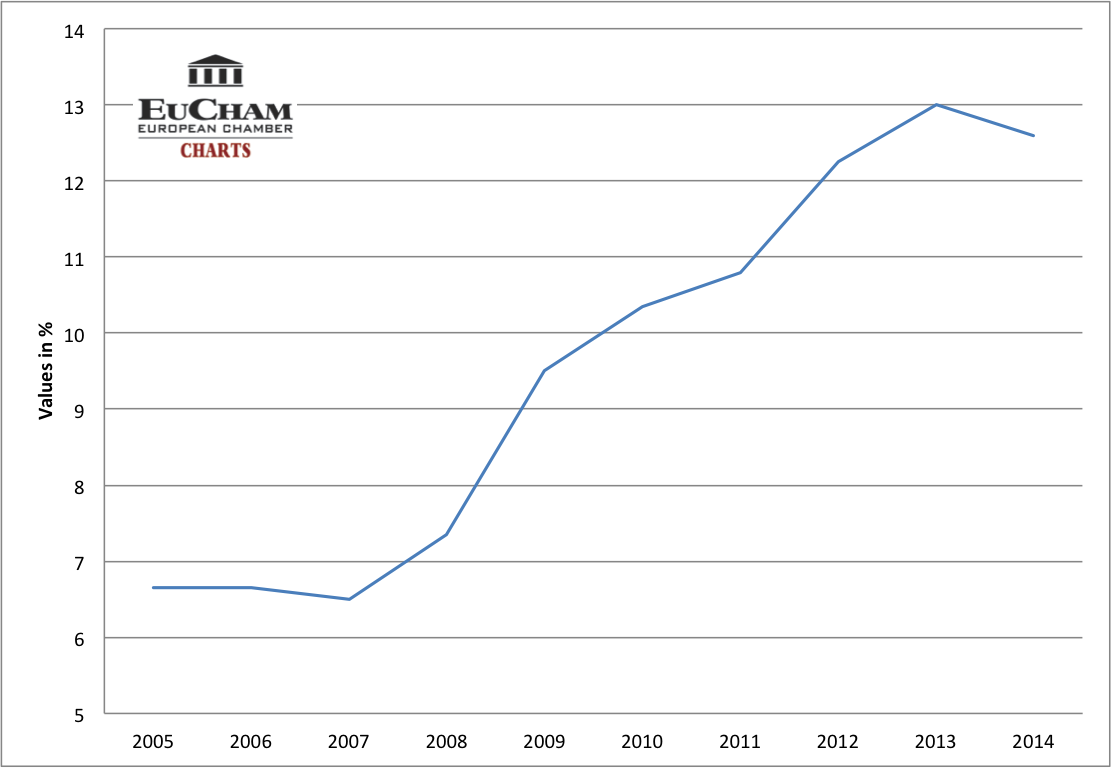
– Europe average –
Figure 2: Unemployment rate based on education level
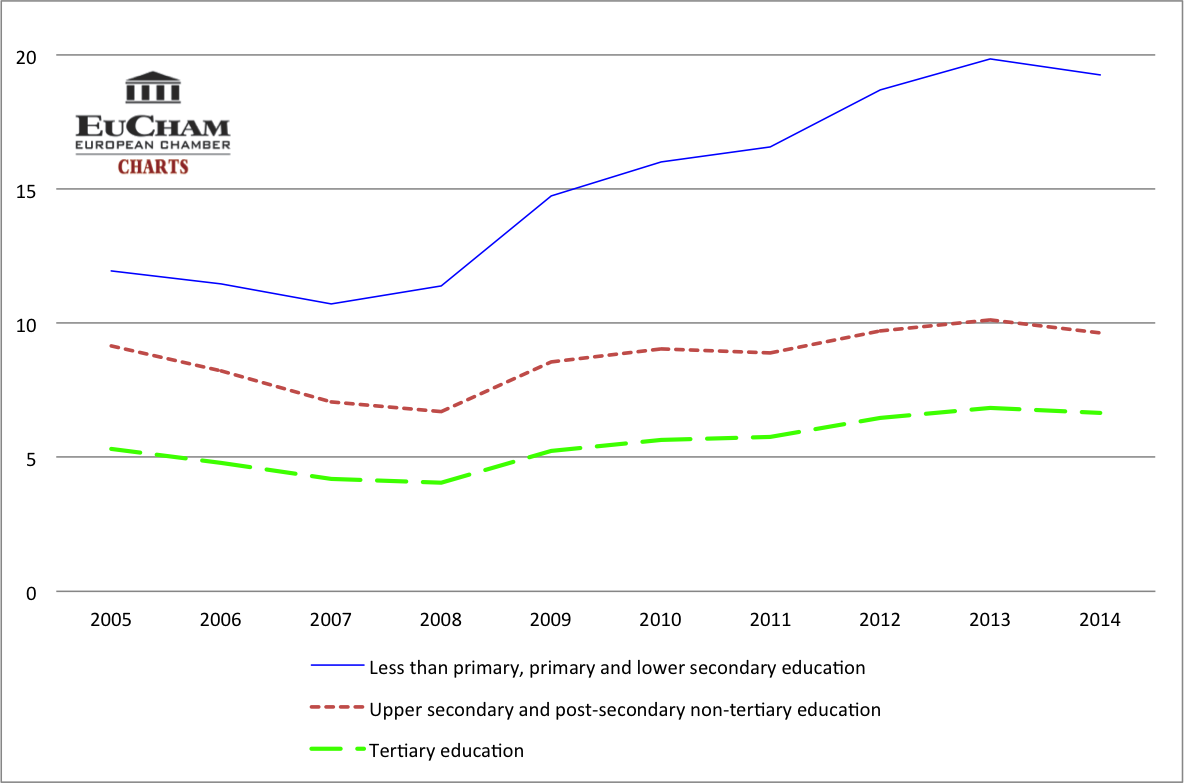
– Europe average –
Table 1: Unemployment rate based on education level
– Average values over 10 years –
|
Country |
Unemployment rate in basic education |
Unemployment rate in advanced education |
Difference in unemployment rate |
|
|
1 |
Turkey |
9.12% |
9.39% |
-0.27 |
|
2 |
Cyprus |
7.89% |
5.89% |
2.00 |
|
3 |
Portugal |
10.04% |
7.58% |
2.46 |
|
4 |
Romania |
7.06% |
4.30% |
2.76 |
|
5 |
Greece |
12.82% |
10.03% |
2.79 |
|
6 |
Luxemburg |
6.99% |
3.55% |
3.44 |
|
7 |
Netherlands |
6.51% |
2.60% |
3.91 |
|
8 |
Iceland |
6.81% |
2.44% |
4.37 |
|
9 |
Denmark |
8.48% |
4.03% |
4.45 |
|
10 |
Switzerland |
7.31% |
2.76% |
4.55 |
|
11 |
Italy |
10.22% |
5.65% |
4.57 |
|
12 |
Norway |
7.17% |
2.05% |
5.12 |
|
13 |
Croatia |
13.54% |
7.42% |
6.12 |
|
14 |
Austria |
8.80% |
2.40% |
6.40 |
|
15 |
Slovenia |
10.39% |
3.86% |
6.53 |
|
16 |
Great Britain |
10.66% |
3.30% |
7.36 |
|
17 |
France |
13.71% |
5.68% |
8.03 |
|
18 |
Malta |
8.64% |
0.60% |
8.04 |
|
19 |
Ireland |
13.33% |
4.78% |
8.55 |
|
20 |
Belgium |
13.57% |
4.25% |
9.32 |
|
21 |
Sweden |
13.47% |
4.07% |
9.40 |
|
Average |
14.08% |
5.03% |
9.60 |
|
|
22 |
Spain |
19.64% |
9.64% |
10.00 |
|
23 |
Finland |
14.75% |
4.03% |
10.72 |
|
24 |
Russia |
14.82% |
4.05% |
10.77 |
|
25 |
Germany |
15.38% |
3.58% |
11.80 |
|
26 |
Estonia |
19.04% |
5.44% |
13.60 |
|
27 |
Poland |
20.69% |
5.79% |
14.90 |
|
28 |
Latvia |
20.77% |
5.72% |
15.05 |
|
29 |
Hungary |
18.72% |
3.21% |
15.51 |
|
30 |
Macedonia |
38.73% |
21.98% |
16.75 |
|
31 |
Lithuania |
22.75% |
5.20% |
17.55 |
|
32 |
Bulgaria |
22.69% |
4.90% |
17.79 |
|
33 |
Czech Republic |
23.96% |
2.36% |
21.60 |
|
34 |
Slovakia |
45.47% |
5.13% |
40.34 |
Source: EuroStat and ILOSTAT reports
EuCham Research Department – Compiled by Petra Nemeth 2015-08