EuCham – European Chamber lists European countries according to their youth unemployment rates in 2014. In general, youth unemployment has risen over the past decades and is much higher than unemployment among older people in the society (OECD, 2009). The difference between youth unemployment and total unemployment rates is analysed as well as the causes and results of high youth unemployment.
Youth unemployment rates have risen over the past decades and often exceeds the unemployment rates of the older people in the society. Nordic countries have the lowest unemployment rates within Europe which is a result of their strong transition system from education to employment. Europe can be divided in three parts in terms of youth unemployment rates; low rates in Northern countries, high rates in Southern / Mediterranean countries and the rest ranking in the middle.
Download PDF
EuCham Research
October 2015
Youth unemployment rates in Europe
| Rank | Country | Unemployment rate (%) |
| 1 | Netherlands | 5.0 |
| 2 | Norway | 5.5 |
| 3 |
Denmark | 5.8 |
| 3 | Iceland | 5.8 |
| 4 | Luxembourg | 6.3 |
| … | ||
| 34 | Moldova | 30.9 |
EuCham data based on International Labour Organization (ILO)
34 European countries were considered
- Youth unemployment rates have risen over the past decades and often exceeds the unemployment rates of the older people in the society.
- Nordic countries have the lowest unemployment rates within Europe which is a result of their strong transition system from education to employment.
- Europe can be divided in three parts in terms of youth unemployment rates; low rates in Northern countries, high rates in Southern / Mediterranean countries and the rest ranking in the middle.
Source: eucham.eu/charts
Detailed Information
EuCham – European Chamber lists European countries according to their youth unemployment rates in 2014. In general, youth unemployment has risen over the past decades and is much higher than unemployment among older people in the society (OECD, 2009). The difference between youth unemployment and total unemployment rates is analysed as well as the causes and results of high youth unemployment.
The importance of young people participating in the workforce is obvious when looking at the economic costs incurred. With high youth unemployment, a nation’s workforce is not used at its full potential. This statement supports the Okun’s law which tells us that a certain amount of a country’s Gross Domestic Product (GDP) is lost with certain rates of unemployment above the natural rate. Although Moldova’s economy grew in 2013, it remains one of the poorest countries in Europe. This explains its high youth unemployment rate of around 31%. The high percentage of young people unemployed in Macedonia (28%) can be related to a lack of investment in education. Three out of ten young people cannot go to school and find a stable job in Macedonia according to the International Labour Organization.
Additionally, young people are more affected by economic downturns as they receive less job protection. Younger aged people are prone to change their jobs more frequently. In hard economic times, employers are more willing to lay off people with less experience (Economist, 2013). Lack of experience and education is also a reason for the challenges of young people finding a job because it leads to skill mismatch. High educated people struggle to find a satisfying job that suits their qualifications and less educated individuals are often under qualified for certain jobs.
Differences in youth unemployment rates among European countries can also be explained by distinct employment policies, educational systems and economic performance (European Commission, 2015). However, in general, youth unemployment rates are higher in Southern European countries such as Spain, Greece, Italy and Croatia (over 17%). These countries have a two-tier economy in common, meaning that some jobs have flexible terms of employment with short contracts while others enjoy high levels of job protection.
In contrast to that, Northern European countries such as Denmark, Netherlands, Norway and Iceland have low youth unemployment rates beneath 6%. These countries present strong transition systems from education to employment helping young people to find a job easily.
Activities such as Youth Guarantee and Youth Unemployment Initiative of the European Commission are intended to ensure the reduction of youth unemployment in Europe.
Methodology
This ranking includes most recent data taken from the ILO. Data are not older than two years. The ILO defines youth unemployment as the number of individuals between 15 and 24 years old divided by the youth labour force which consists of youth people neither in education, employment nor training (called NEET’s).
Figure 1: Total and youth unemployment rates compared (rates in %)
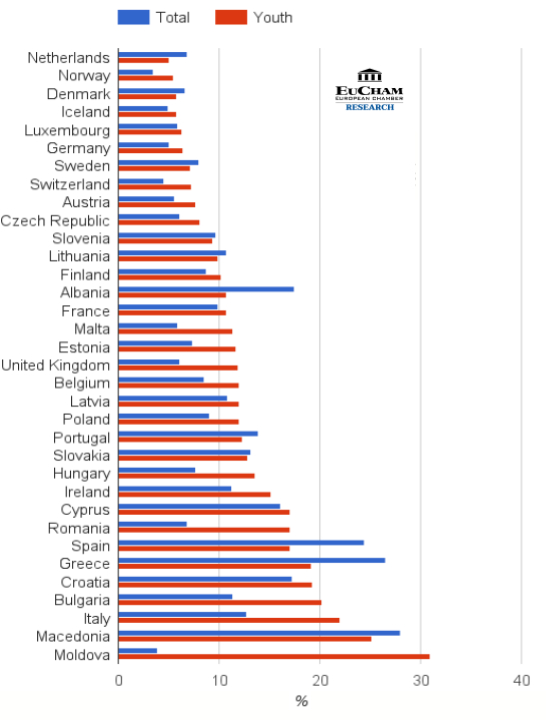
Figure 2: Youth Unemployment rates
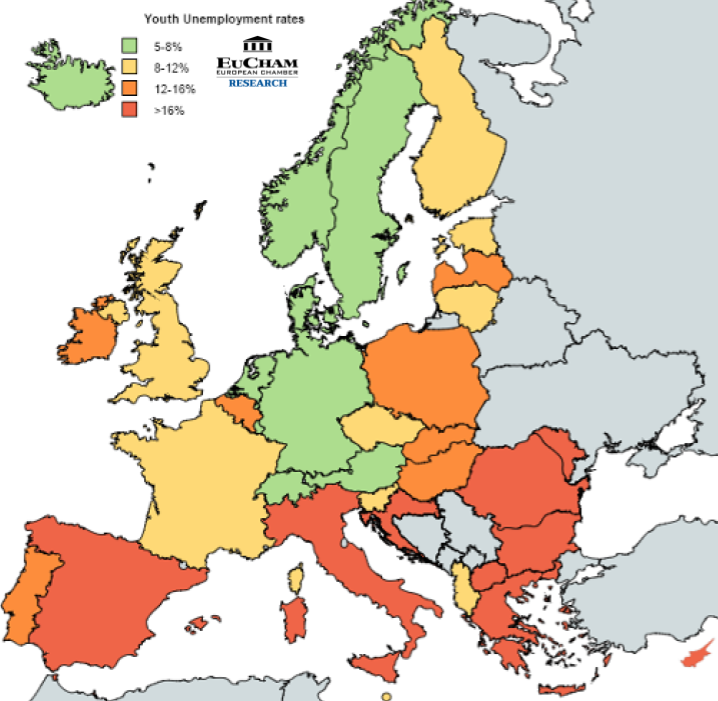
Table 1: Total and youth unemployment rates
| Rank | Country | Total unemployment rate (%) | Youth unemployment rate (%) |
| 1 | Netherlands | 6.8 | 5.0 |
| 2 | Norway | 3.5 | 5.5 |
| 3 | Denmark | 6.6 | 5.8 |
| 4 | Iceland | 4.9 | 5.8 |
| 5 | Luxembourg | 5.9 | 6.3 |
| 6 | Germany | 5.0 | 6.4 |
| 7 | Sweden | 8.0 | 7.2 |
| 8 | Switzerland | 4.5 | 7.3 |
| 9 | Austria | 5.6 | 7.7 |
| 10 | Czech Republic | 6.1 | 8.1 |
| 11 | Slovenia | 9.7 | 9.4 |
| 12 | Lithuania | 10.7 | 9.9 |
| 13 | Finland | 8.7 | 10.2 |
| 14 | Albania | 17.5 | 10.7 |
| 15 | France | 9.9 | 10.7 |
| 16 | Malta | 5.9 | 11.4 |
| 17 | Estonia | 7.4 | 11.7 |
| 18 | United Kingdom | 6.1 | 11.9 |
| 19 | Belgium | 8.5 | 12 |
| 20 | Latvia | 10.8 | 12 |
| 21 | Poland | 9.0 | 12 |
| 22 | Portugal | 13.9 | 12.3 |
| 23 | Slovakia | 13.2 | 12.8 |
| 24 | Hungary | 7.7 | 13.6 |
| 25 | Ireland | 11.3 | 15.2 |
| 26 | Cyprus | 16.1 | 17 |
| 27 | Romania | 6.8 | 17 |
| 28 | Spain | 24.4 | 17.1 |
| 29 | Greece | 26.5 | 19.2 |
| 30 | Croatia | 17.3 | 19.3 |
| 31 | Bulgaria | 11.4 | 20.2 |
| 32 | Italy | 12.7 | 22 |
| 33 | Macedonia | 28 | 25.2 |
| 34 | Moldova | 3.9 | 30.9 |
No data: Andorra, Belarus, Bosnia, Georgia, Kazakhstan, Kosovo, Macedonia, Montenegro, Serbia, Ukraine
Sources: ILO (2013 and 2014), OECD (2009), The Economist (2013), European Commission (2015)
EuCham Research Department – Compiled by Elisa Schulte ter Hardt 2015-09-23