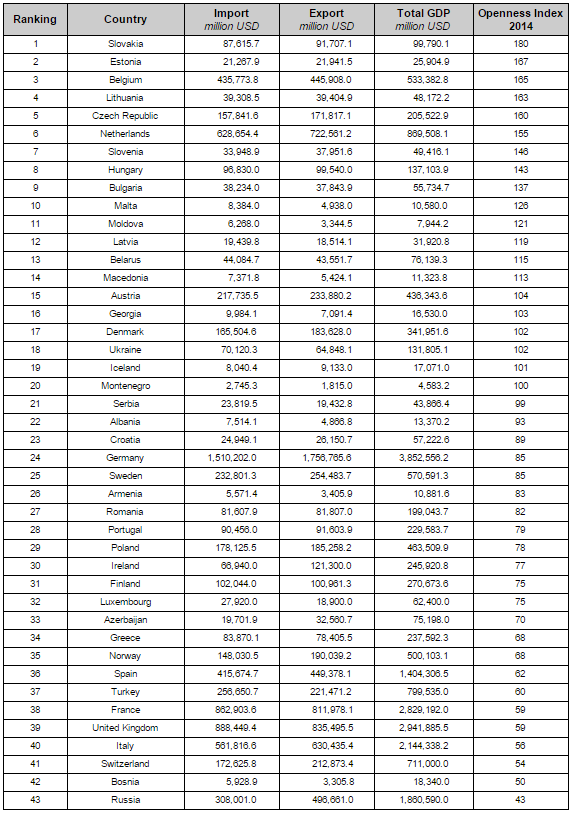
EuCham – European Chamber lists the Trade Openness Index of 43 countries identifying the economic performance of each country related to international trade. By taking the sum of import and export divided by the total GDP, the Index shows the percentage of trade compare with GDP and the differences between countries varying from 43 to 180.
Small economies are usually more dependent on trade than large economies. In general, export exceeds import in many of the countries, which means they are not only able to provide the domestic demand, but foreign markets as well. Trade has an impact on total GDP of the country as it encourages the development and the exchange of goods and services between a country and its international partners. Total GDP is affected by consumer, government and investment spending, importing and exporting.
Download PDF
EuCham Research
November 2015
Trade Openness Index of European Countries
| Country |
Trade Openness Index | |
| 1 | Slovakia | 180 |
| 2 | Estonia | 167 |
| 3 | Belgium | 165 |
| 4 | Lithuania | 163 |
| 5 | Czech Republic | 160 |
| … | ||
| 43 | Russia | 43 |
EuCham data based on World Bank data reports
43 European countries were considered
- Small economies are usually more dependent on trade than large economies. In general, export exceeds import in many of the countries, which means they are not only able to provide the domestic demand, but foreign markets as well.
- Trade has an impact on total GDP of the country as it encourages the development and the exchange of goods and services between a country and its international partners.
- Total GDP is affected by consumer, government and investment spending, importing and exporting.
Source: eucham.eu/charts
Detailed Information
EuCham – European Chamber lists the Trade Openness Index of 43 countries identifying the economic performance of each country related to international trade. By taking the sum of import and export divided by the total GDP, the Index shows the percentage of trade compare with GDP and the differences between countries varying from 43 to 180.
Foreign trade has a significant impact on total GDP of the country. Trade encourages the development not only for the country itself but also for international partners. For instance, one country can increase their trade by concentrating on the production of comparative advantage goods and export to the international market. Other countries can also benefit from trade as they can enter and invest in tangible and intangible channels such as technology transfer, allocation and distribution of resources.
According to OECD iLibrary, small economies typically depend more on international trade than large economies as they can only export a limited number merchandise based on the specialty. Nevertheless, small economies import more goods and services to provide the domestic demand. The statistic shows that Slovakia has the highest Index, with value in import and export of 87.8% and 91.9%, respectively, to the total GDP. Therefore, it is the most open country when trading with other countries. On the other hand, Russia comes last with an Index of 43. In 2014, Russia went under severe economic crisis as the ruble currency dropped together with the oil price, which led to the large change in exports and GDP as oil and gas account for 67% of Russia’s exports. As a result, it placed major impact on the trade and economy of Russia from mid-2014.
The higher value of import and export compared with GDP results in the higher the Index. The main reason for it is that the GDP is calculated based on the formula:
GDP = Consumption spending + Government spending + Investment spending + (Exports – Imports)
The trade openness of a country also has an effect on the economic growth. It helps to improve imports and exports, which leads to the development of technology with efficient and effective production processes. However, trade is not the only element to decide whether a country’s economy is developing or not. Based on the formula above, total GDP is also be affected by the consumption expenditures, government purchases and investment. The reason why big and strong countries like Spain, France, United Kingdom, Italy, Germany and Russia have lower Index than other countries is that they utilize their spending in three other sectors more than the imports and exports itself, which results in the high total GDP. Moreover, the necessity of trade in larger economies is lower as they can provide the domestic market from their own capacity.
Methodology
All data was retrieved from the World Development Indicators of The World Bank, Trading Economics and Central Intelligence Agency website. The sources include the total import and export, as well as total GDP in million US dollars. The Openness Index is calculated by taking the sum of import and export to divided by total GDP of the country (OECD iLibrary). The year 2014 is considered for the collection of data before implementing the calculation.
Figure 1: Trade Openness Index
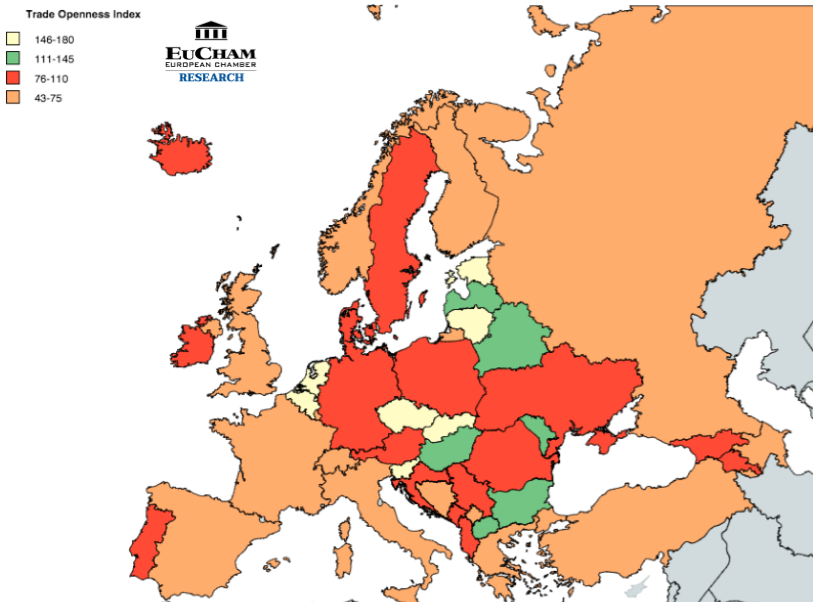
Figure 2: Import, Export and total GDP (for countries with GDP above 1,000,000 Million USD)
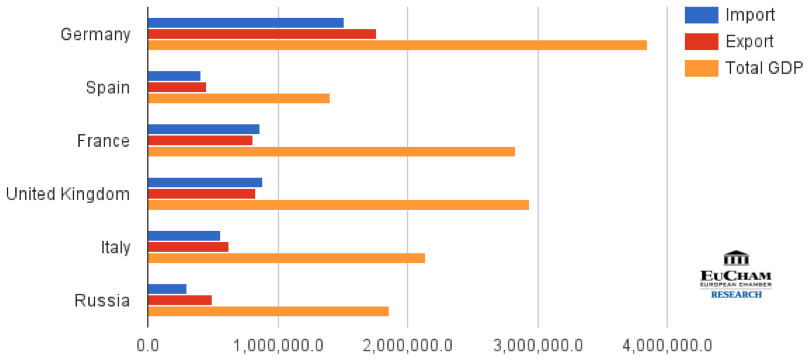
Figure 3: Import, Export and Total GDP (countries with GDP below 1,000,000 Million USD)
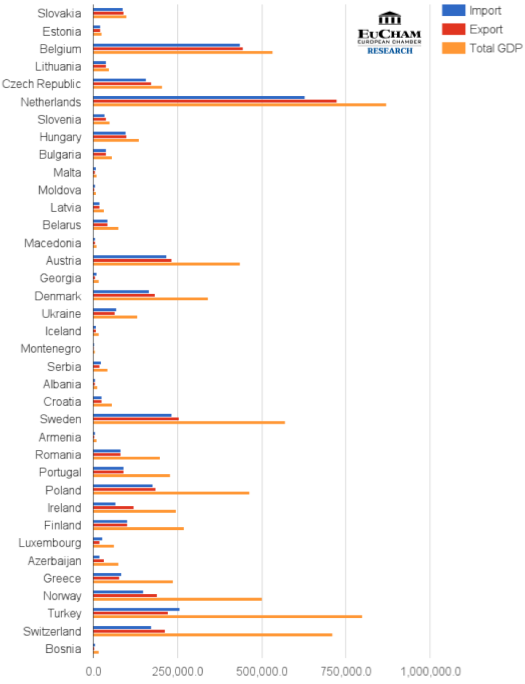
Table 1: Ranking of Trade Openness Index in 2014
No data: Andorra, Liechtenstein, Monaco, San Marino.
Source: World Bank (2015), OECD iLibrary (2011), Trading Economics (2015), Central Intelligence Agency (2015)
EuCham Research Department – Compiled by Mai Nguyen 2015-10-15