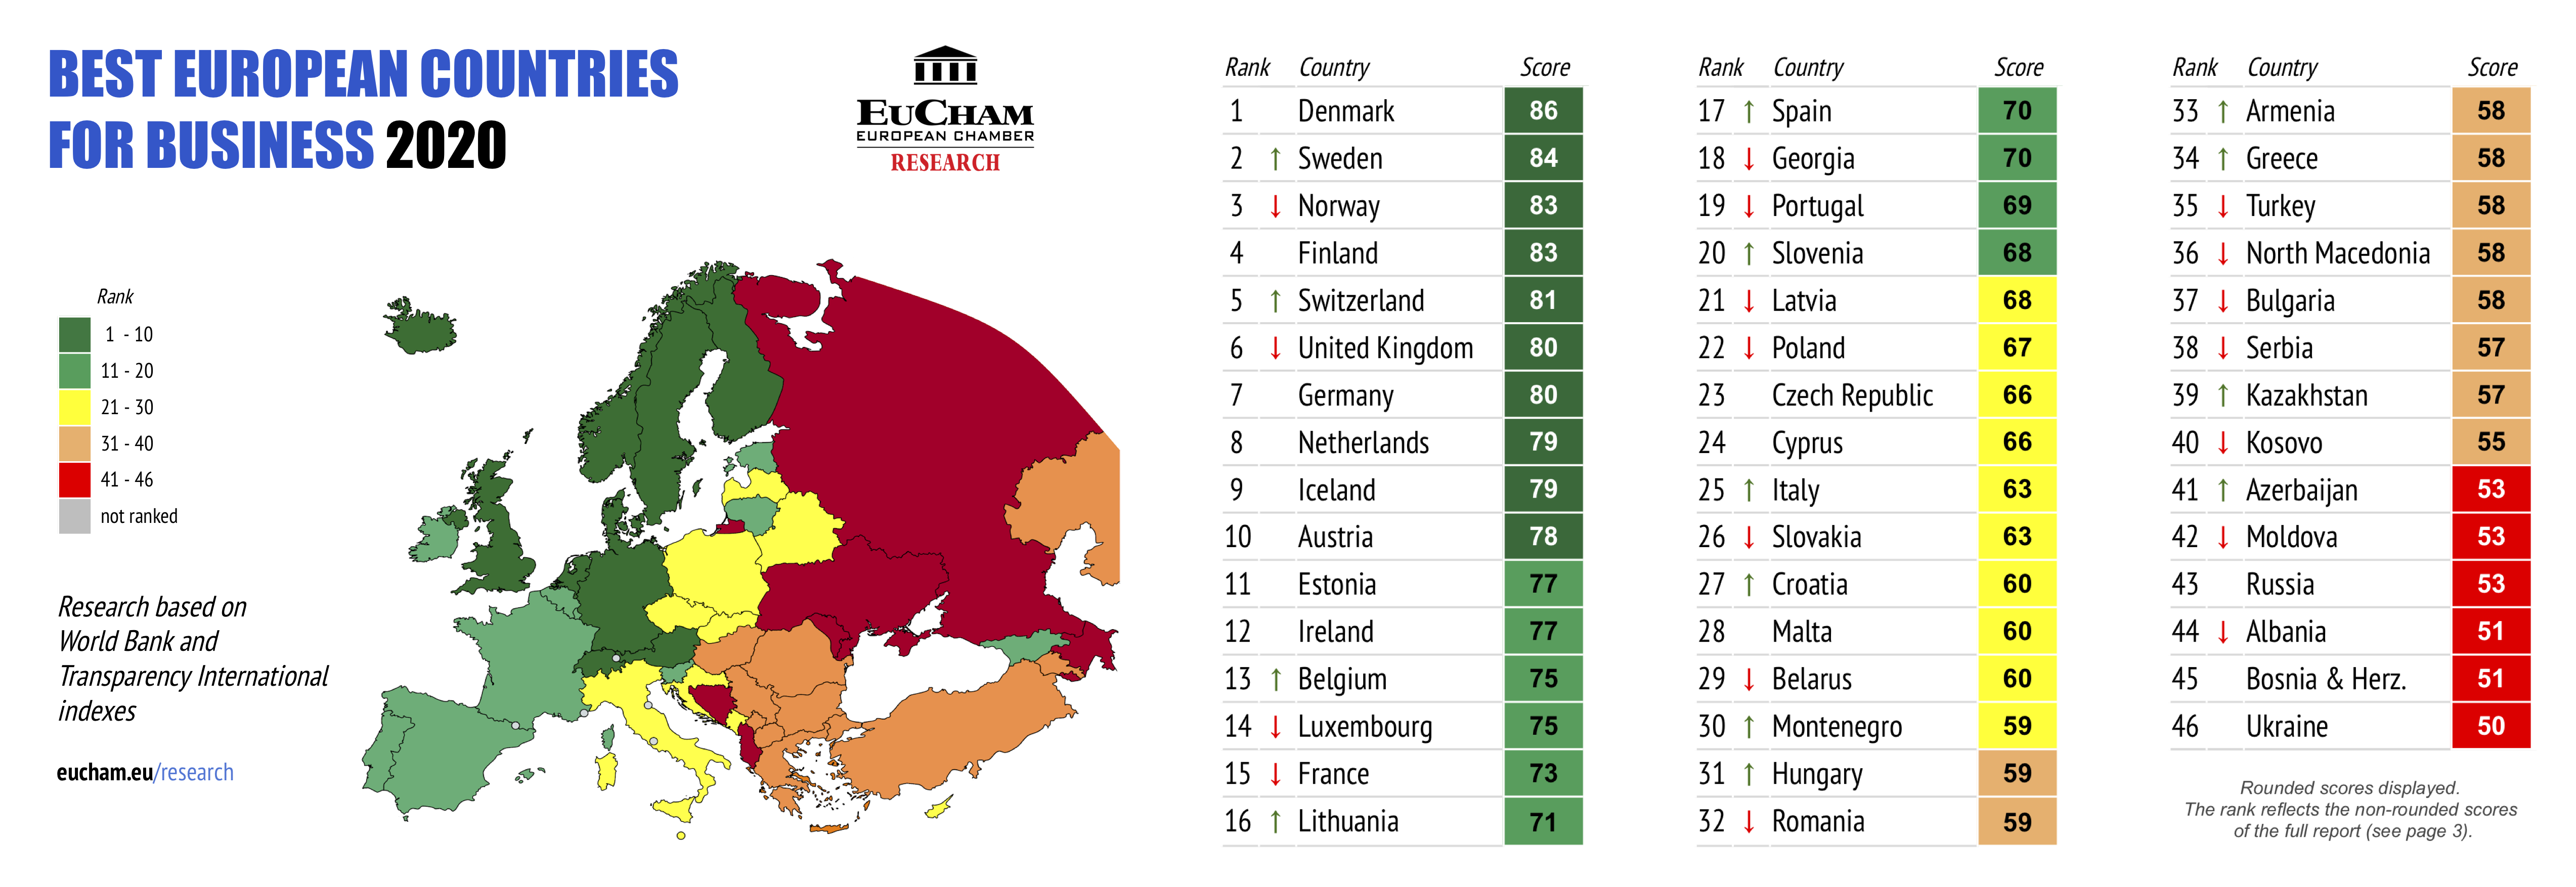
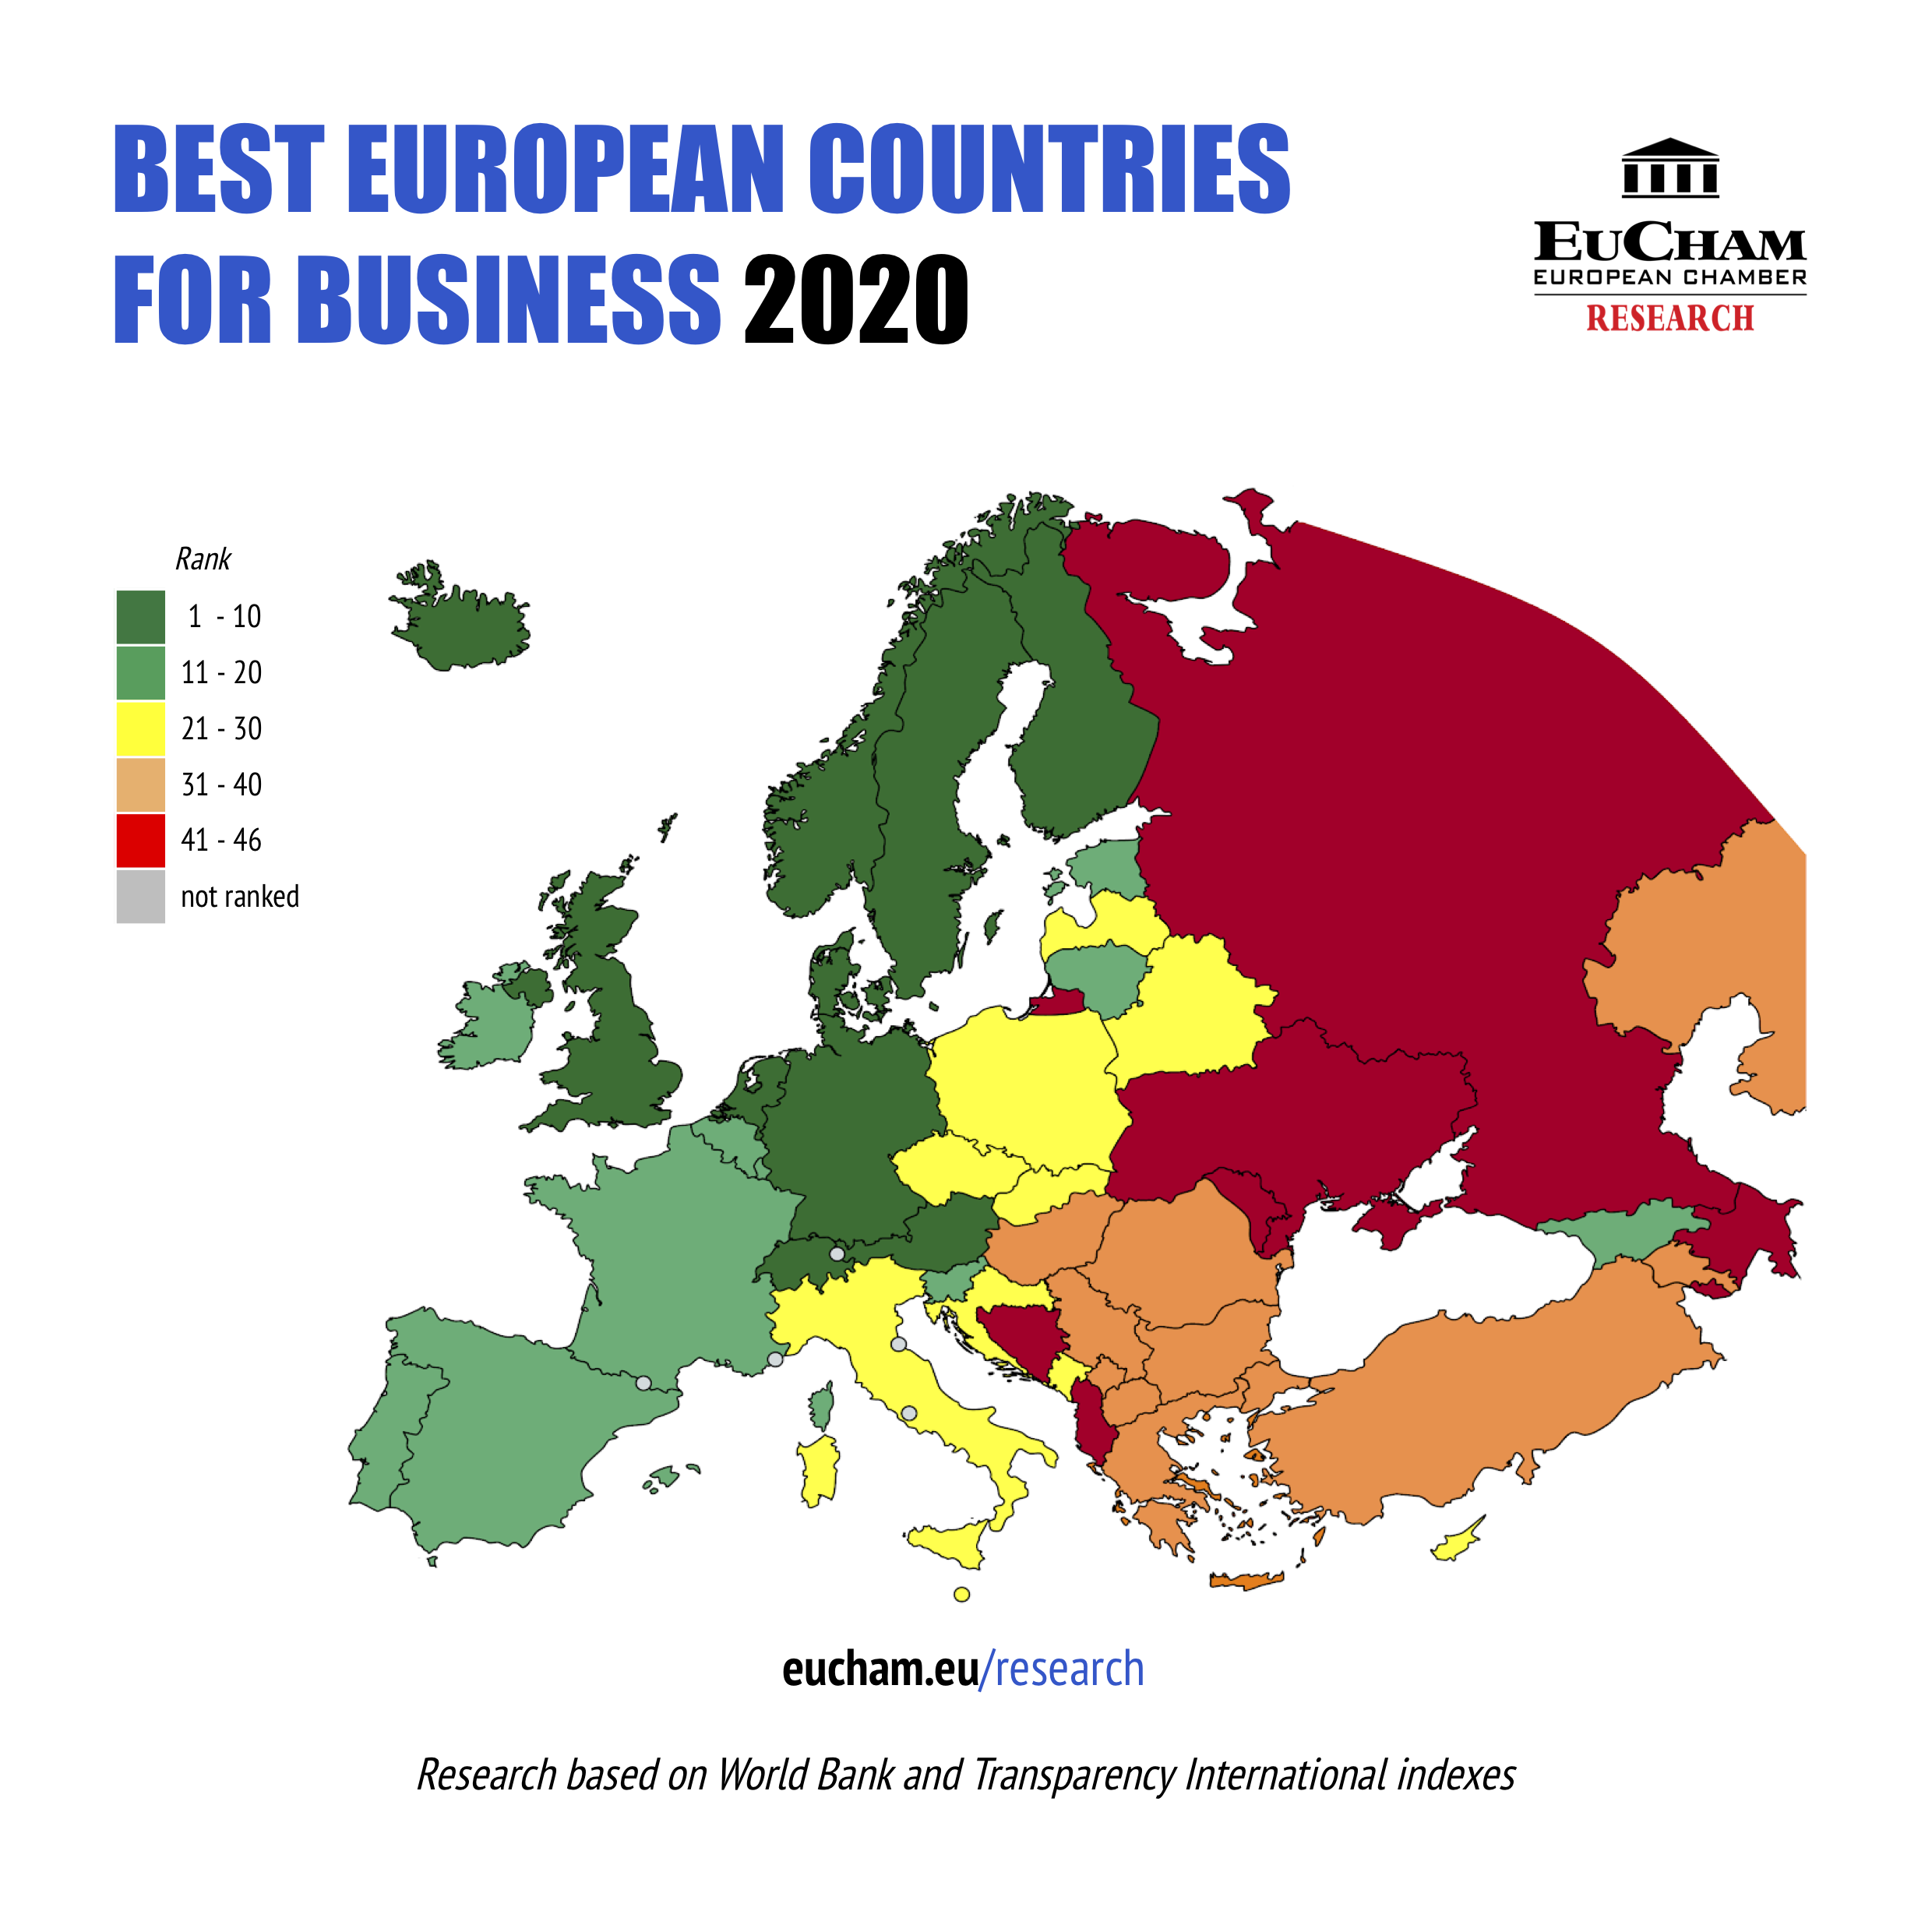
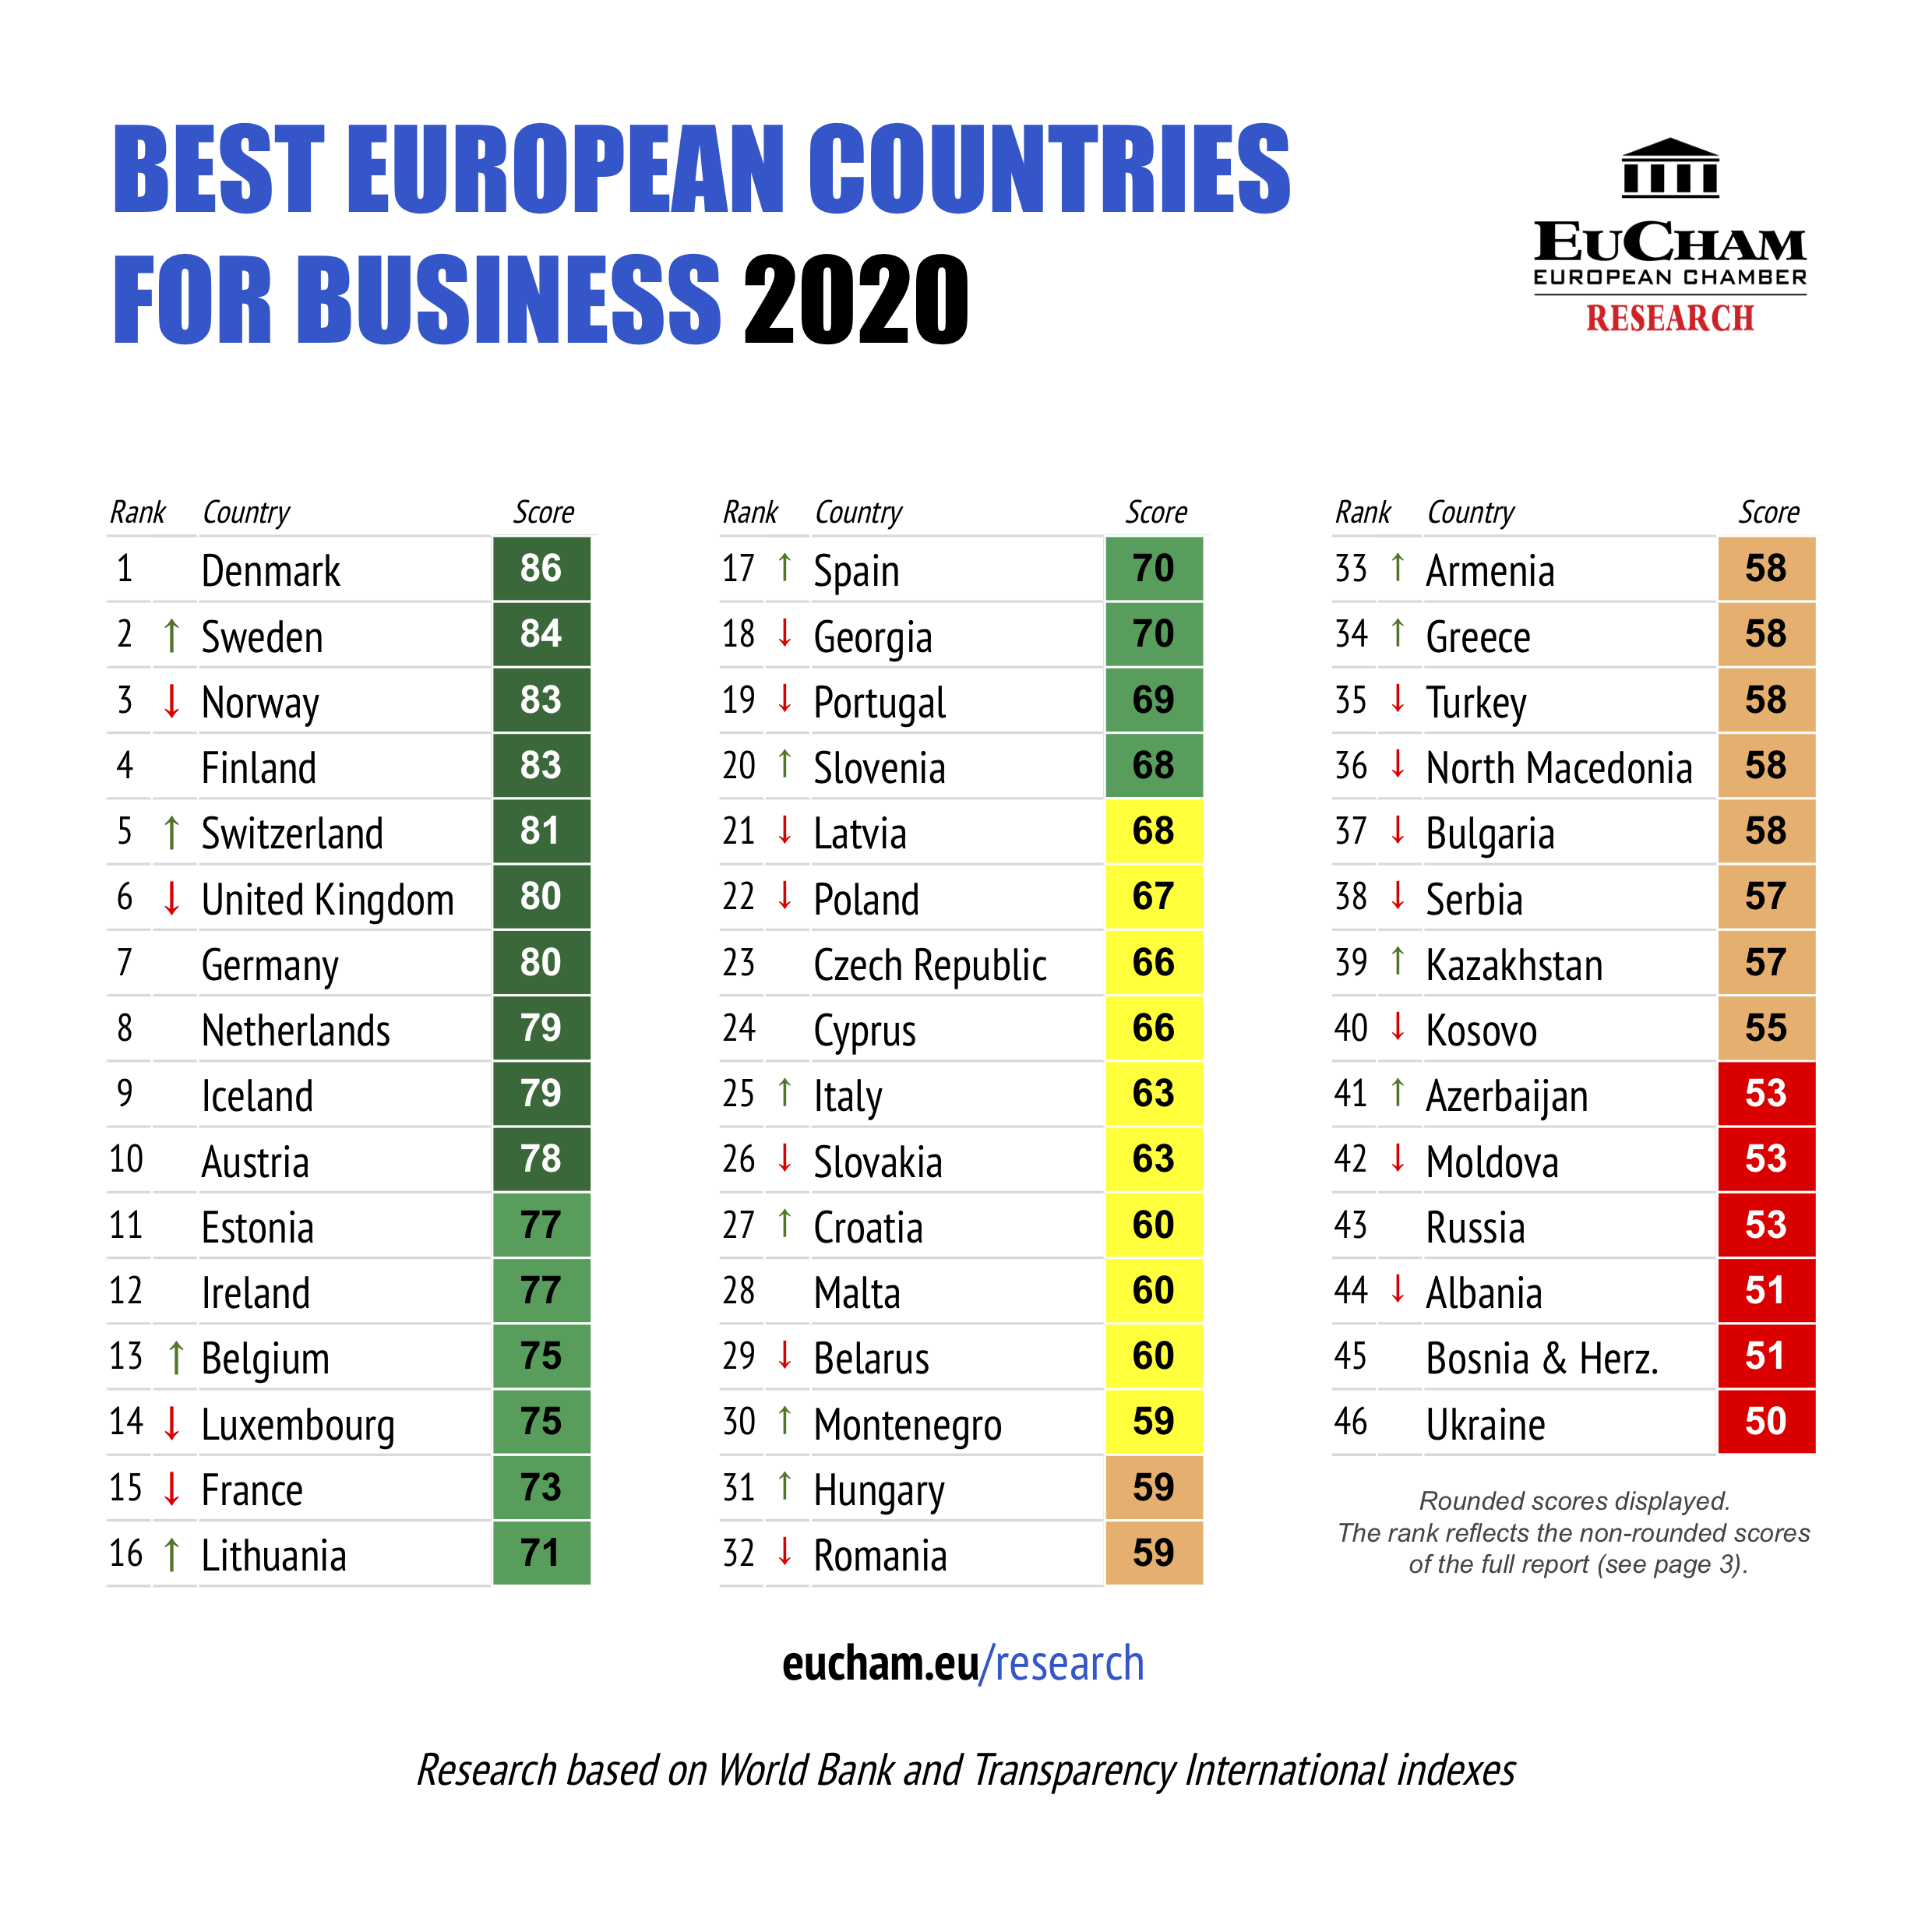
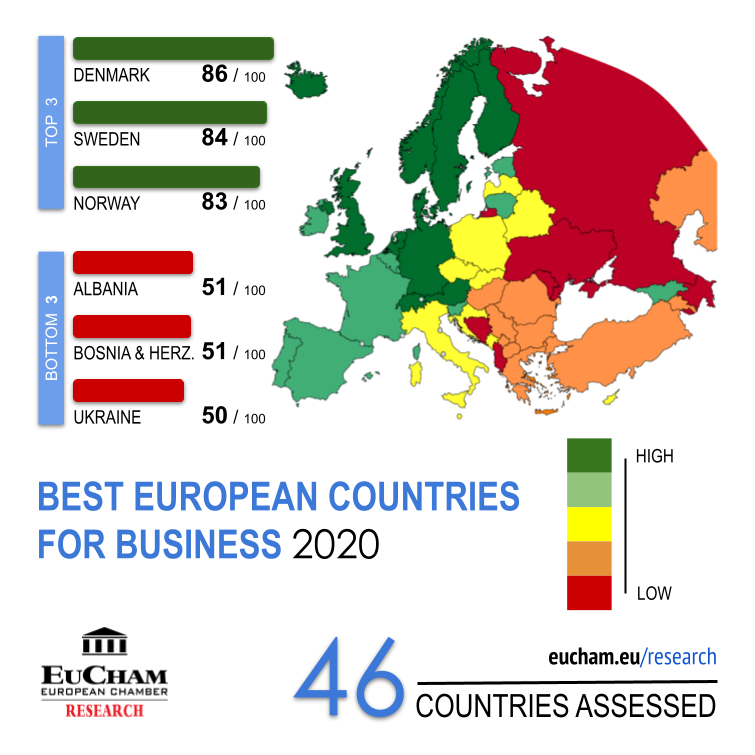
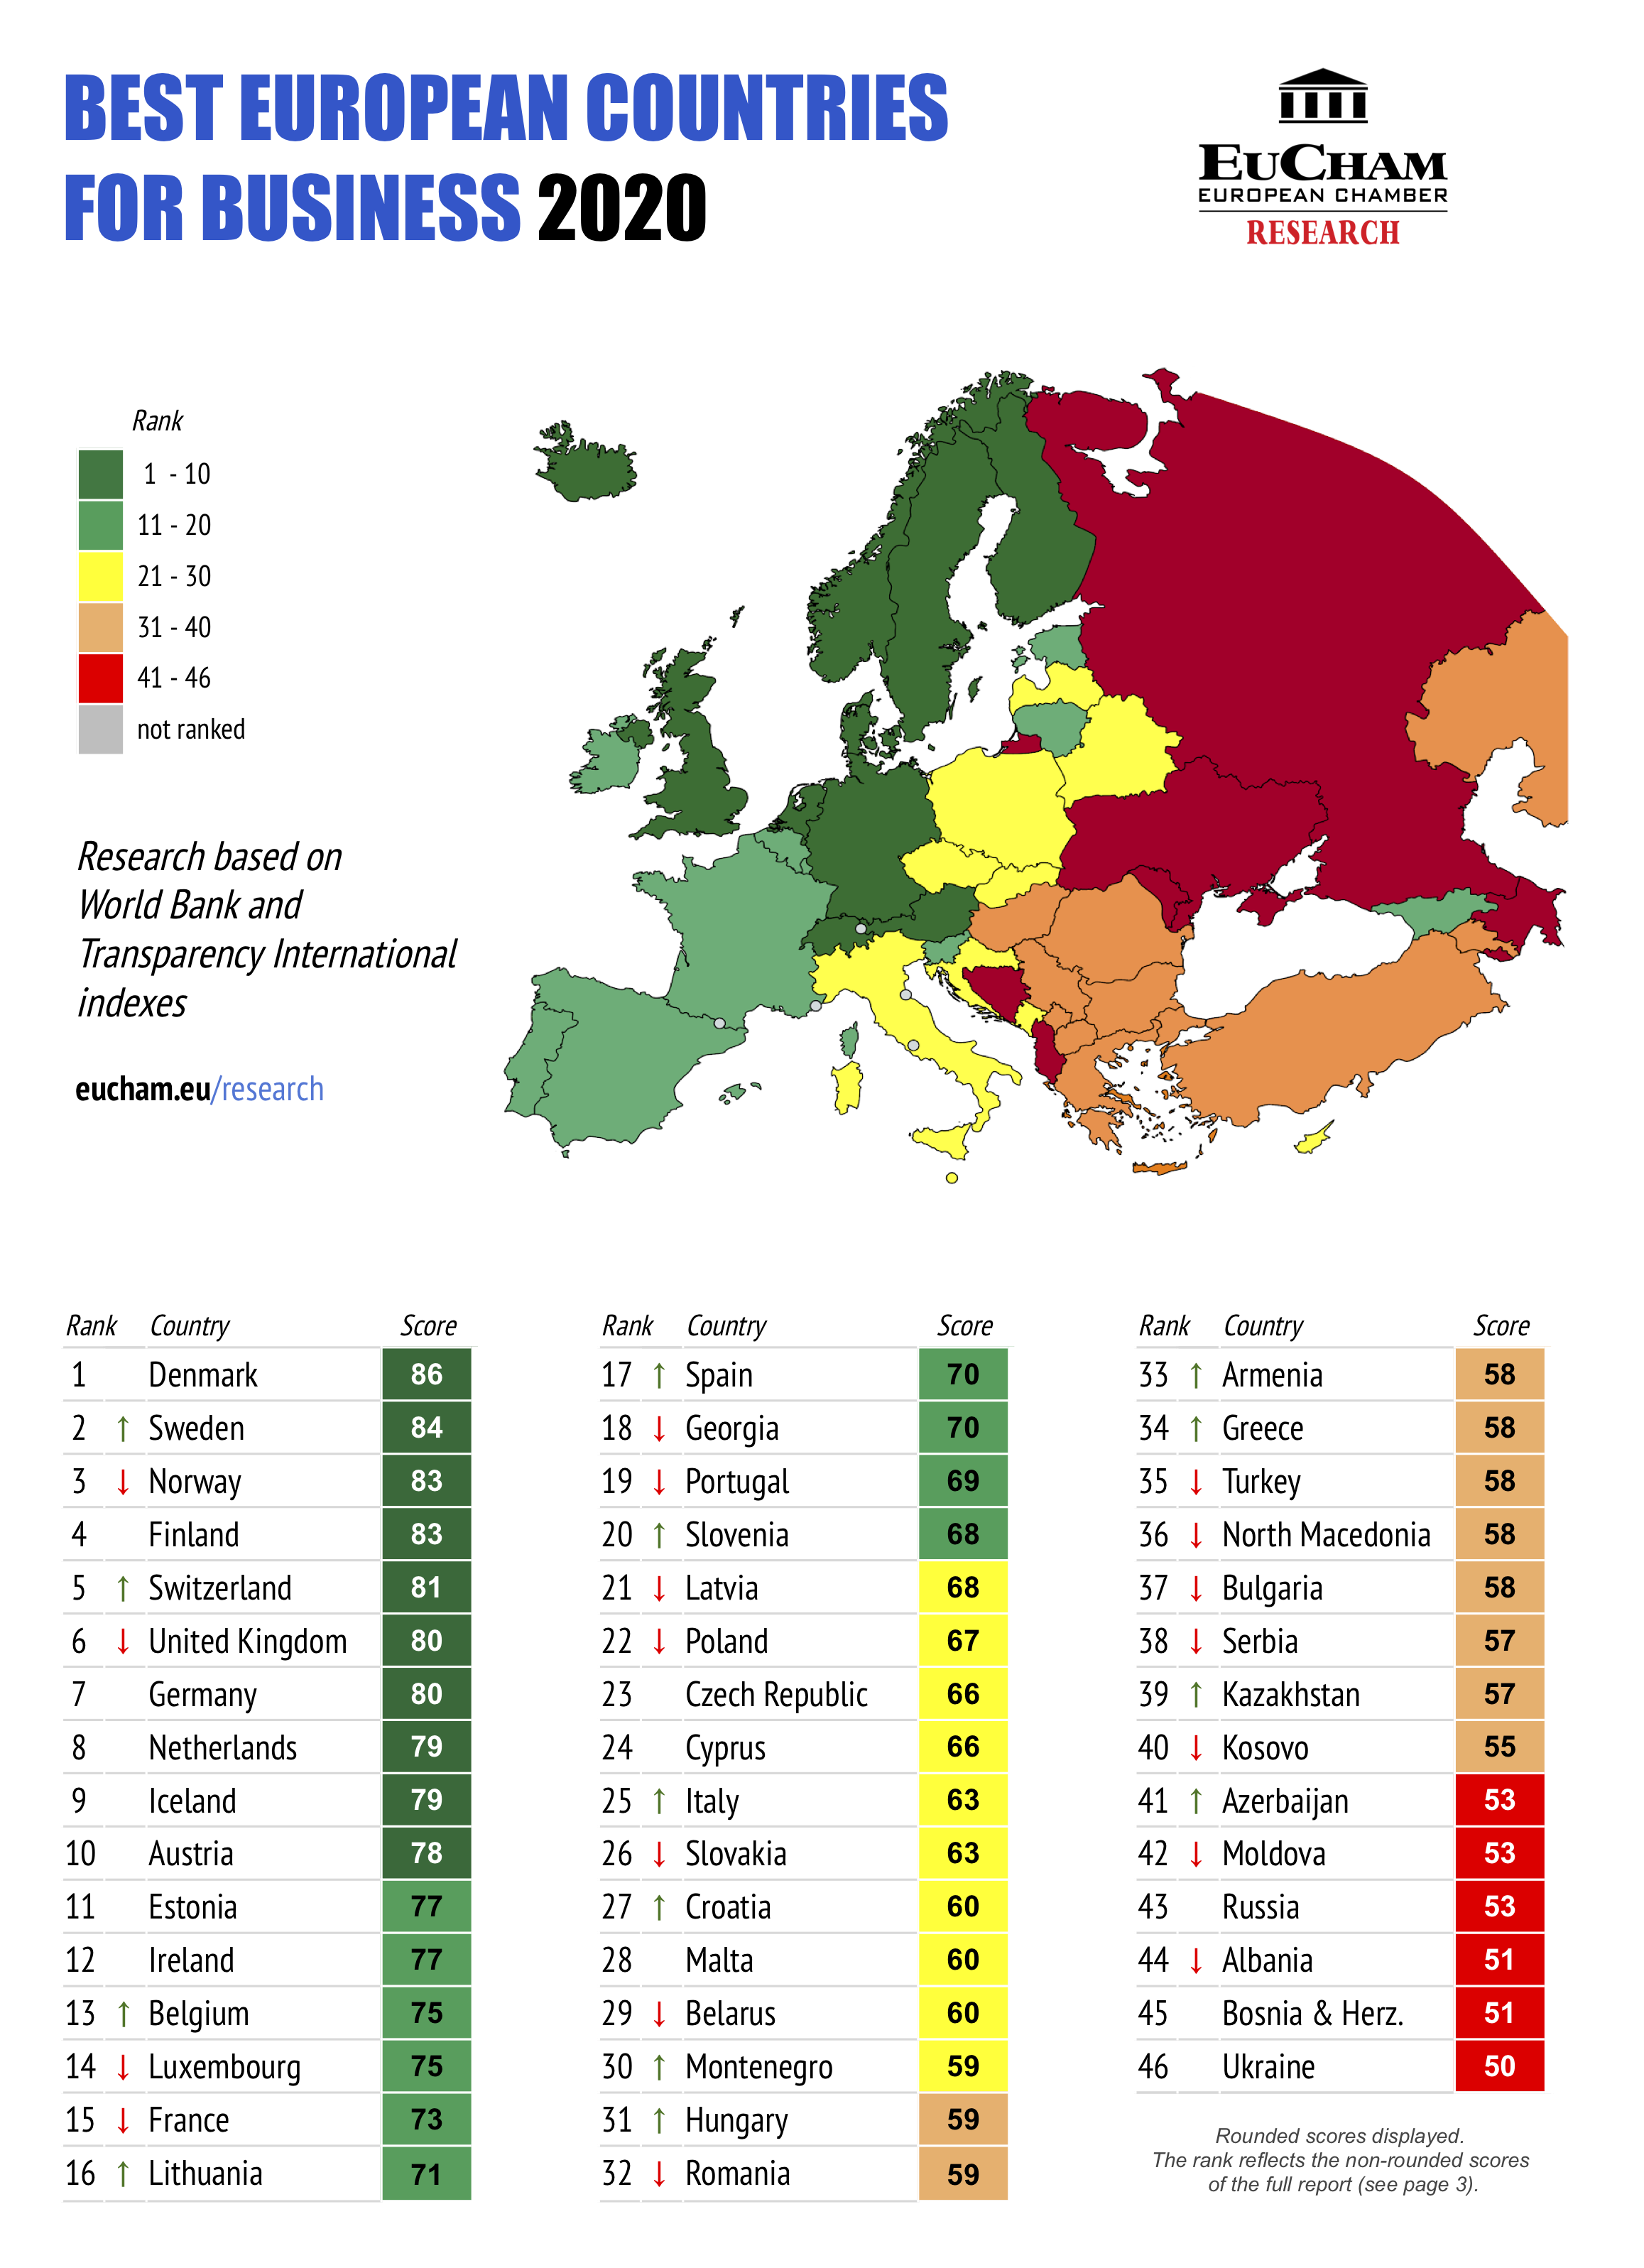
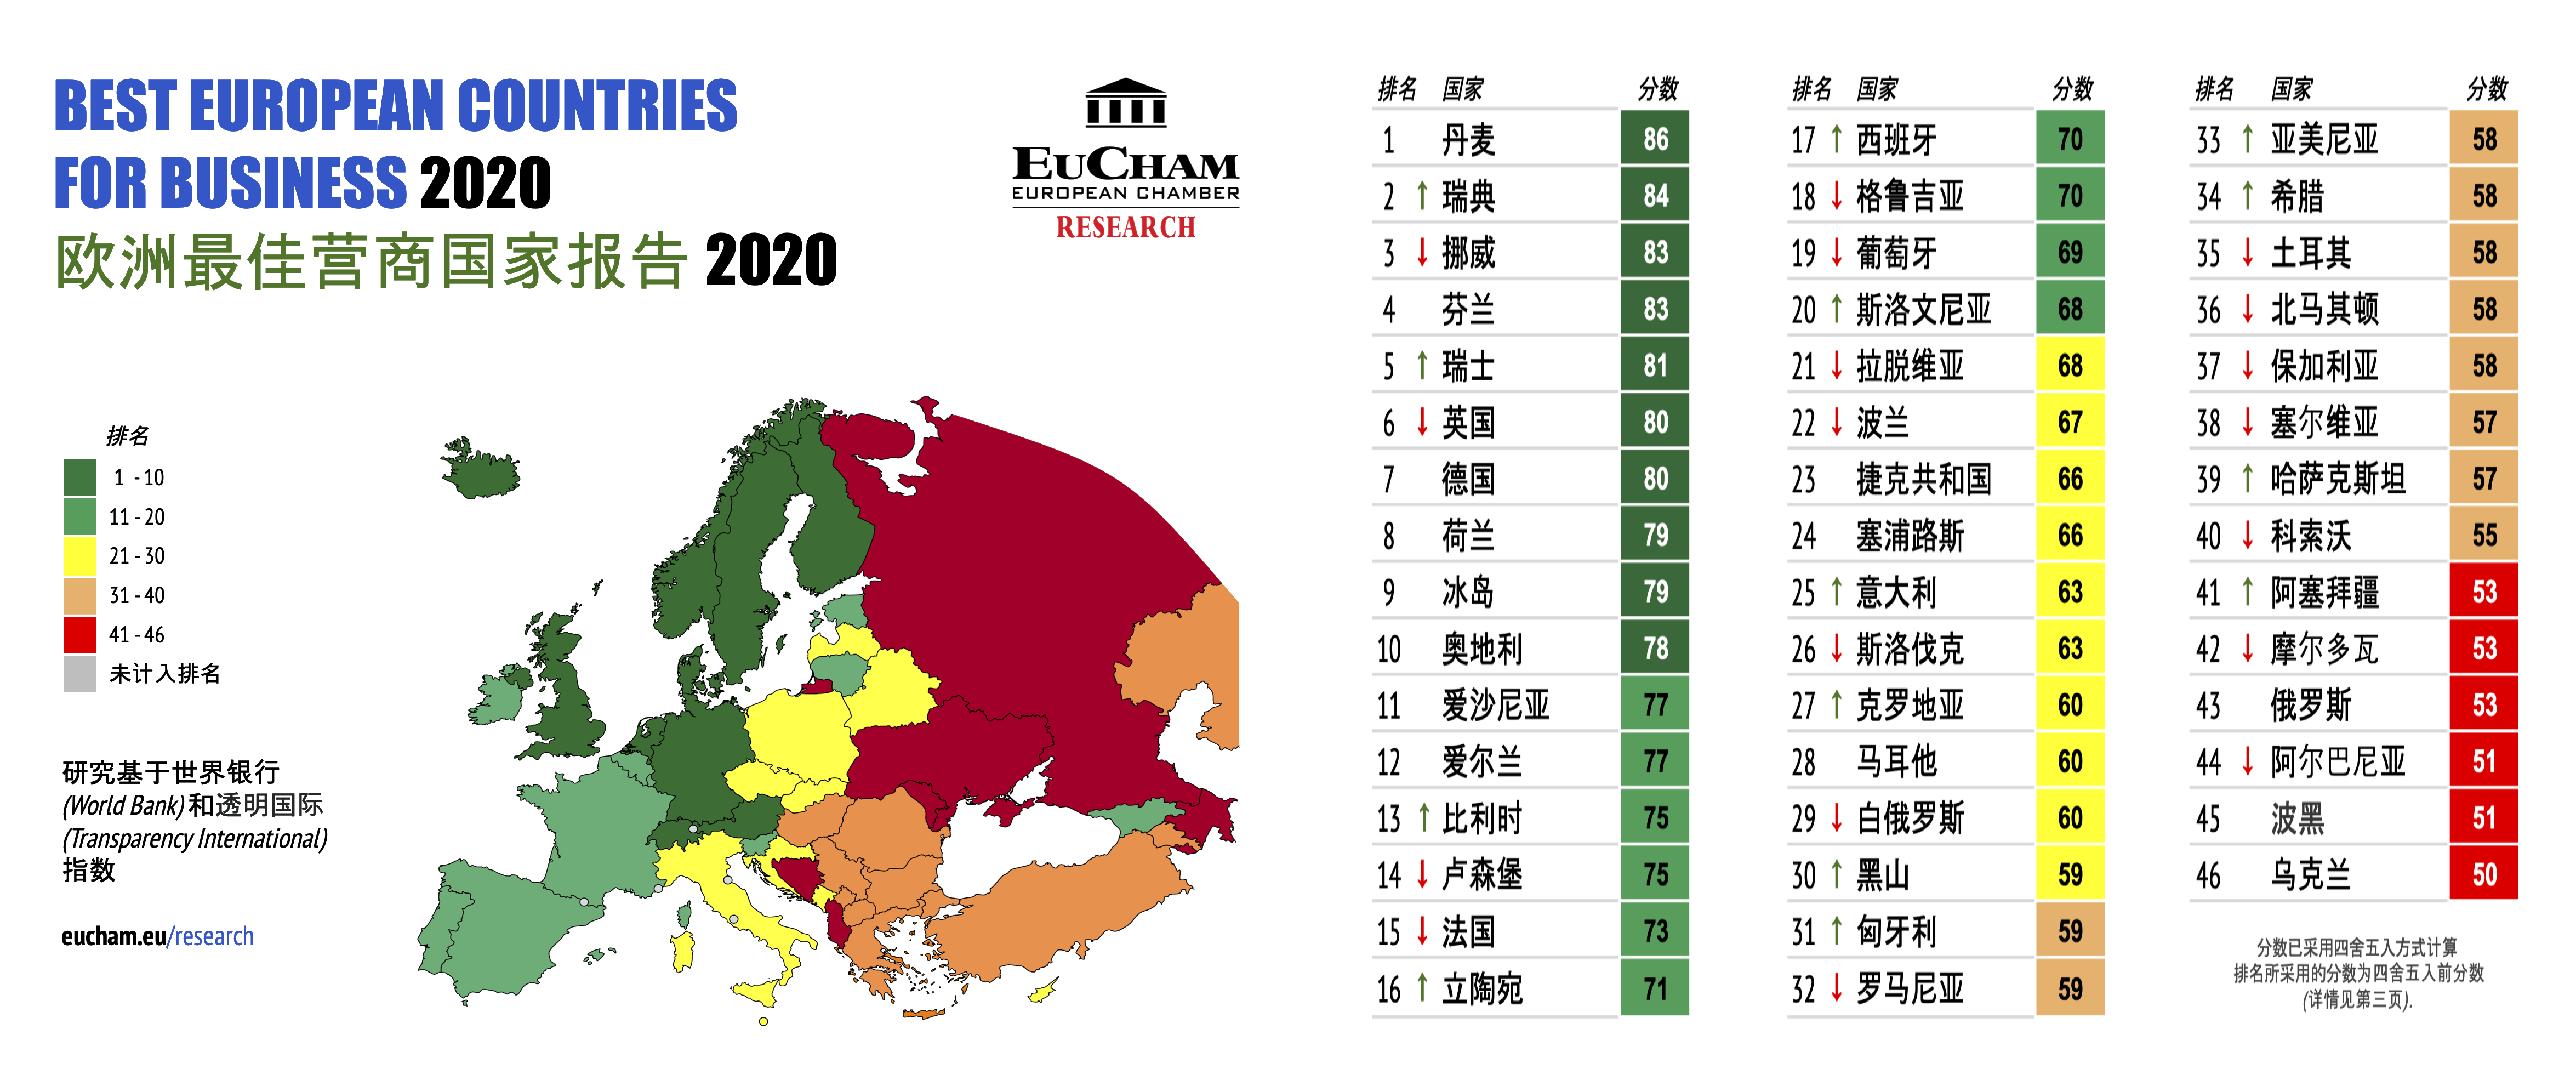
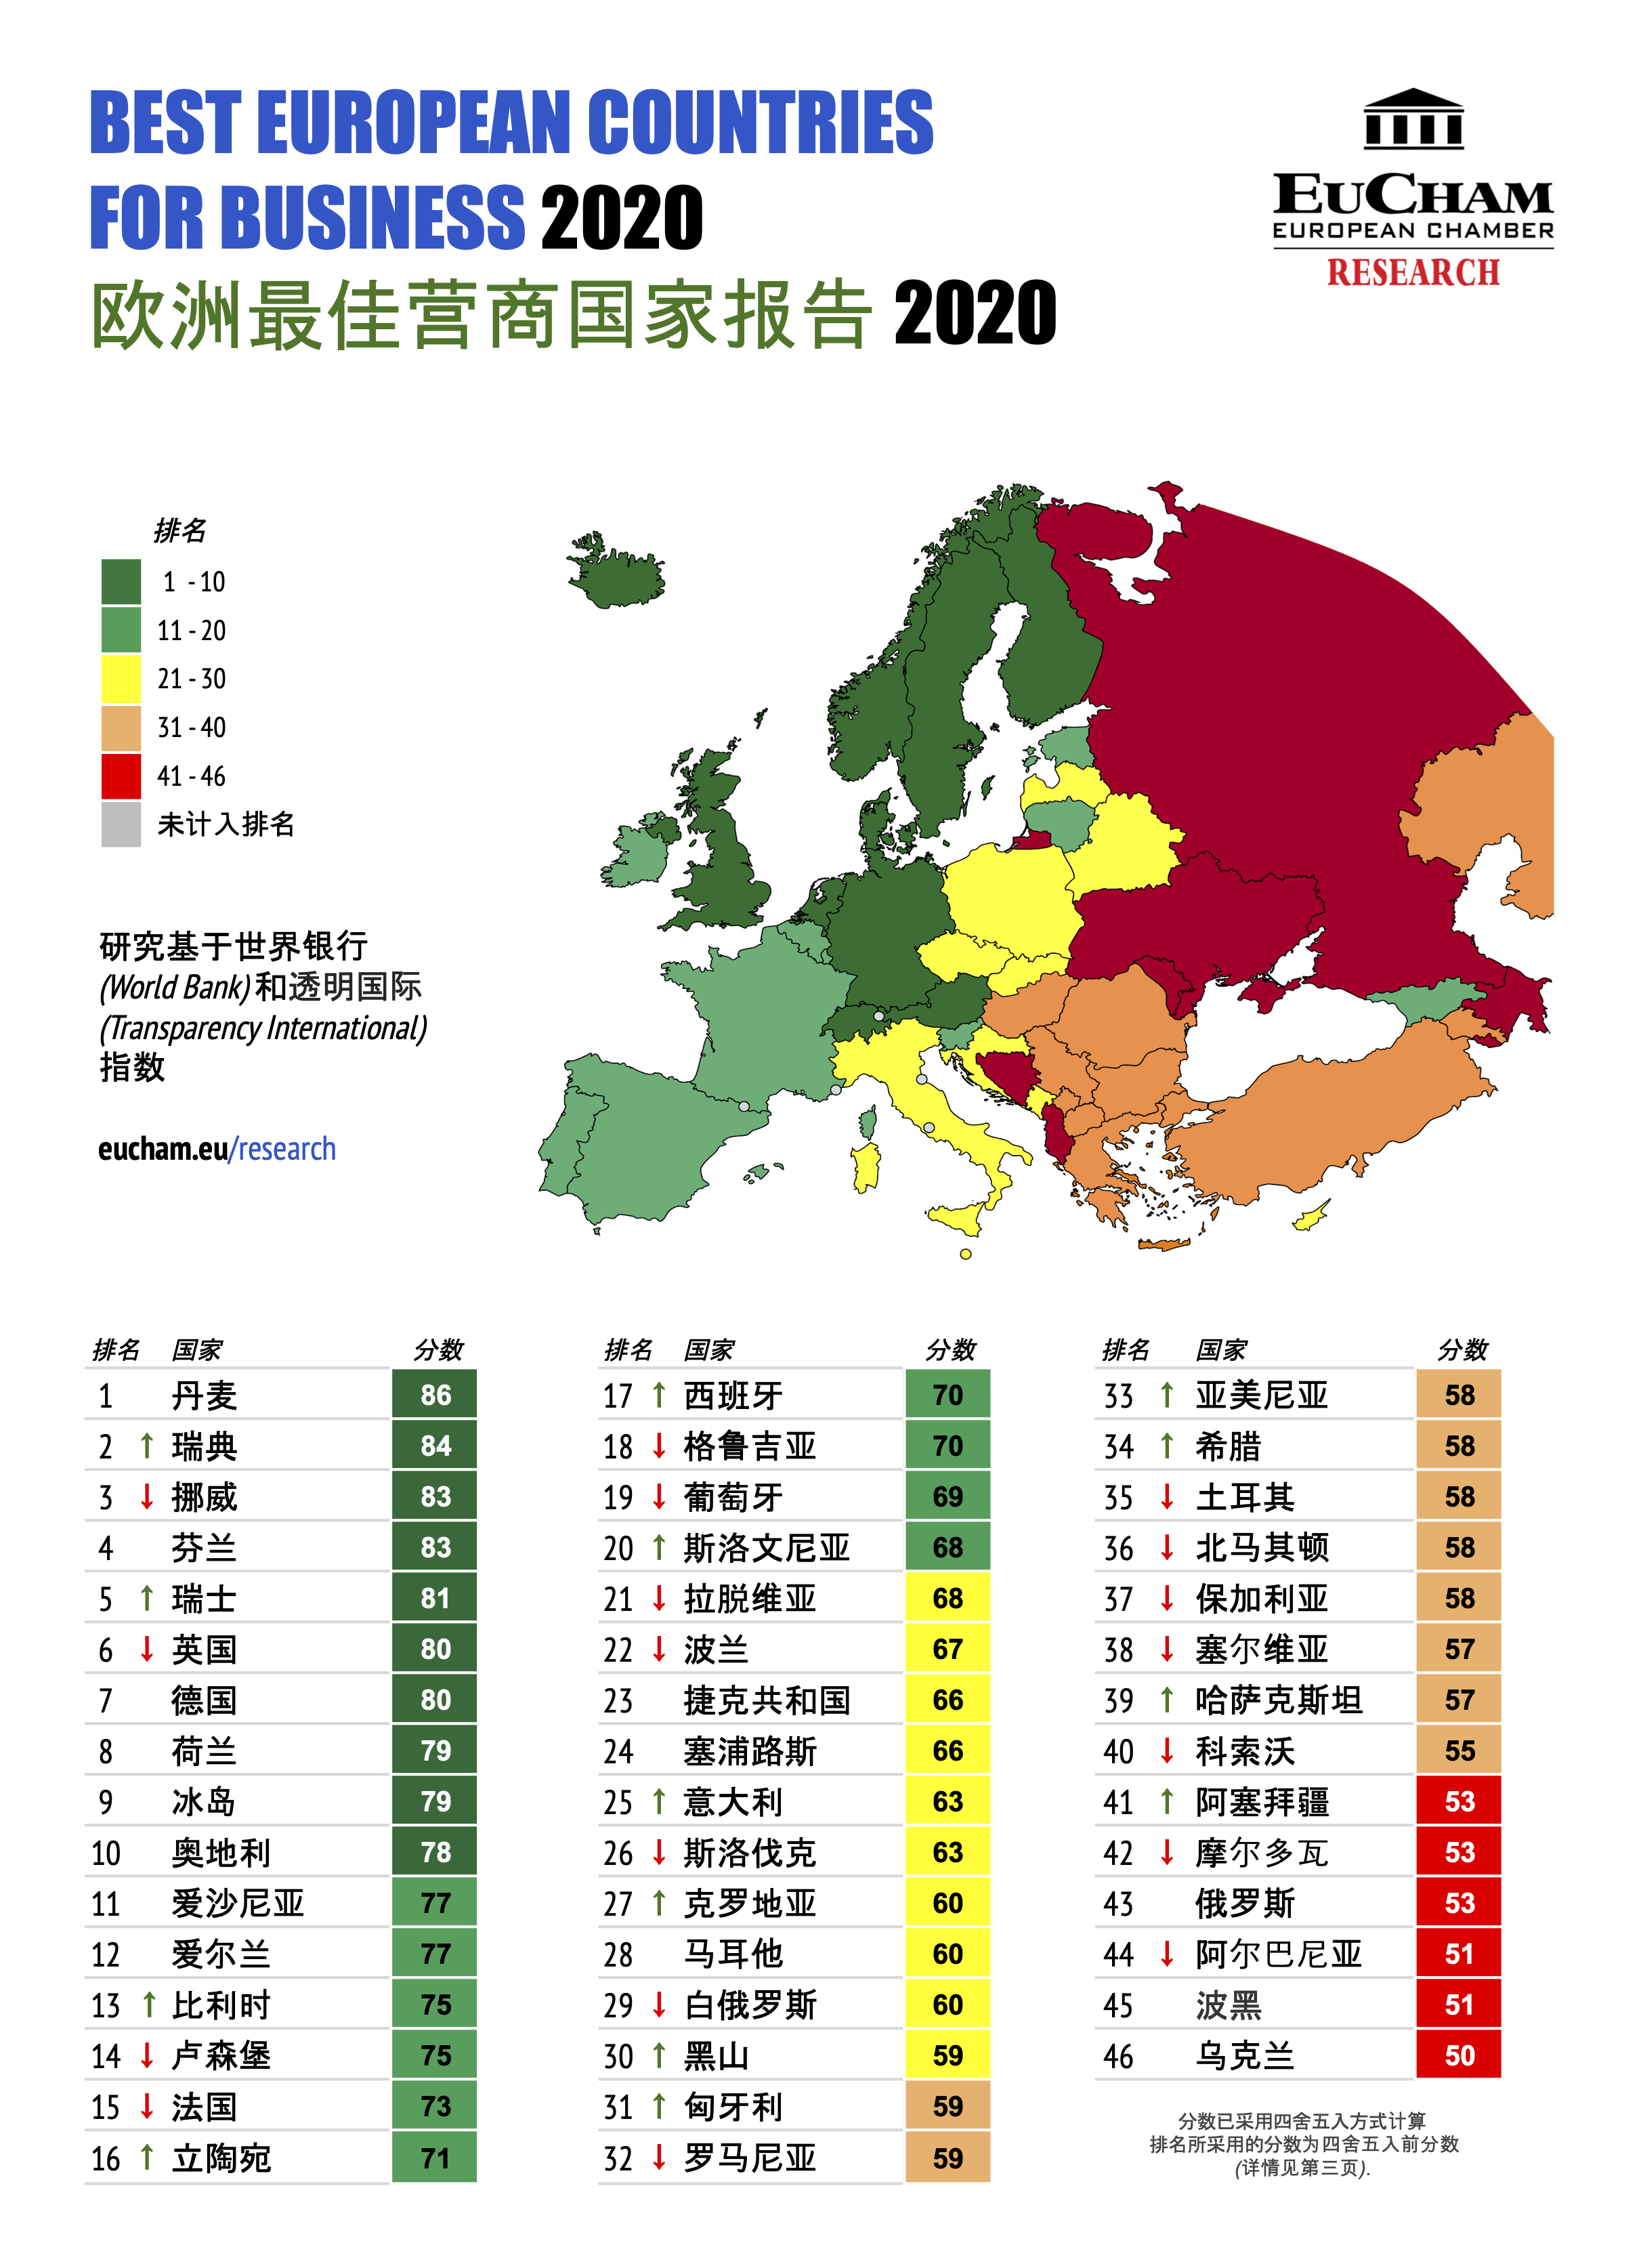
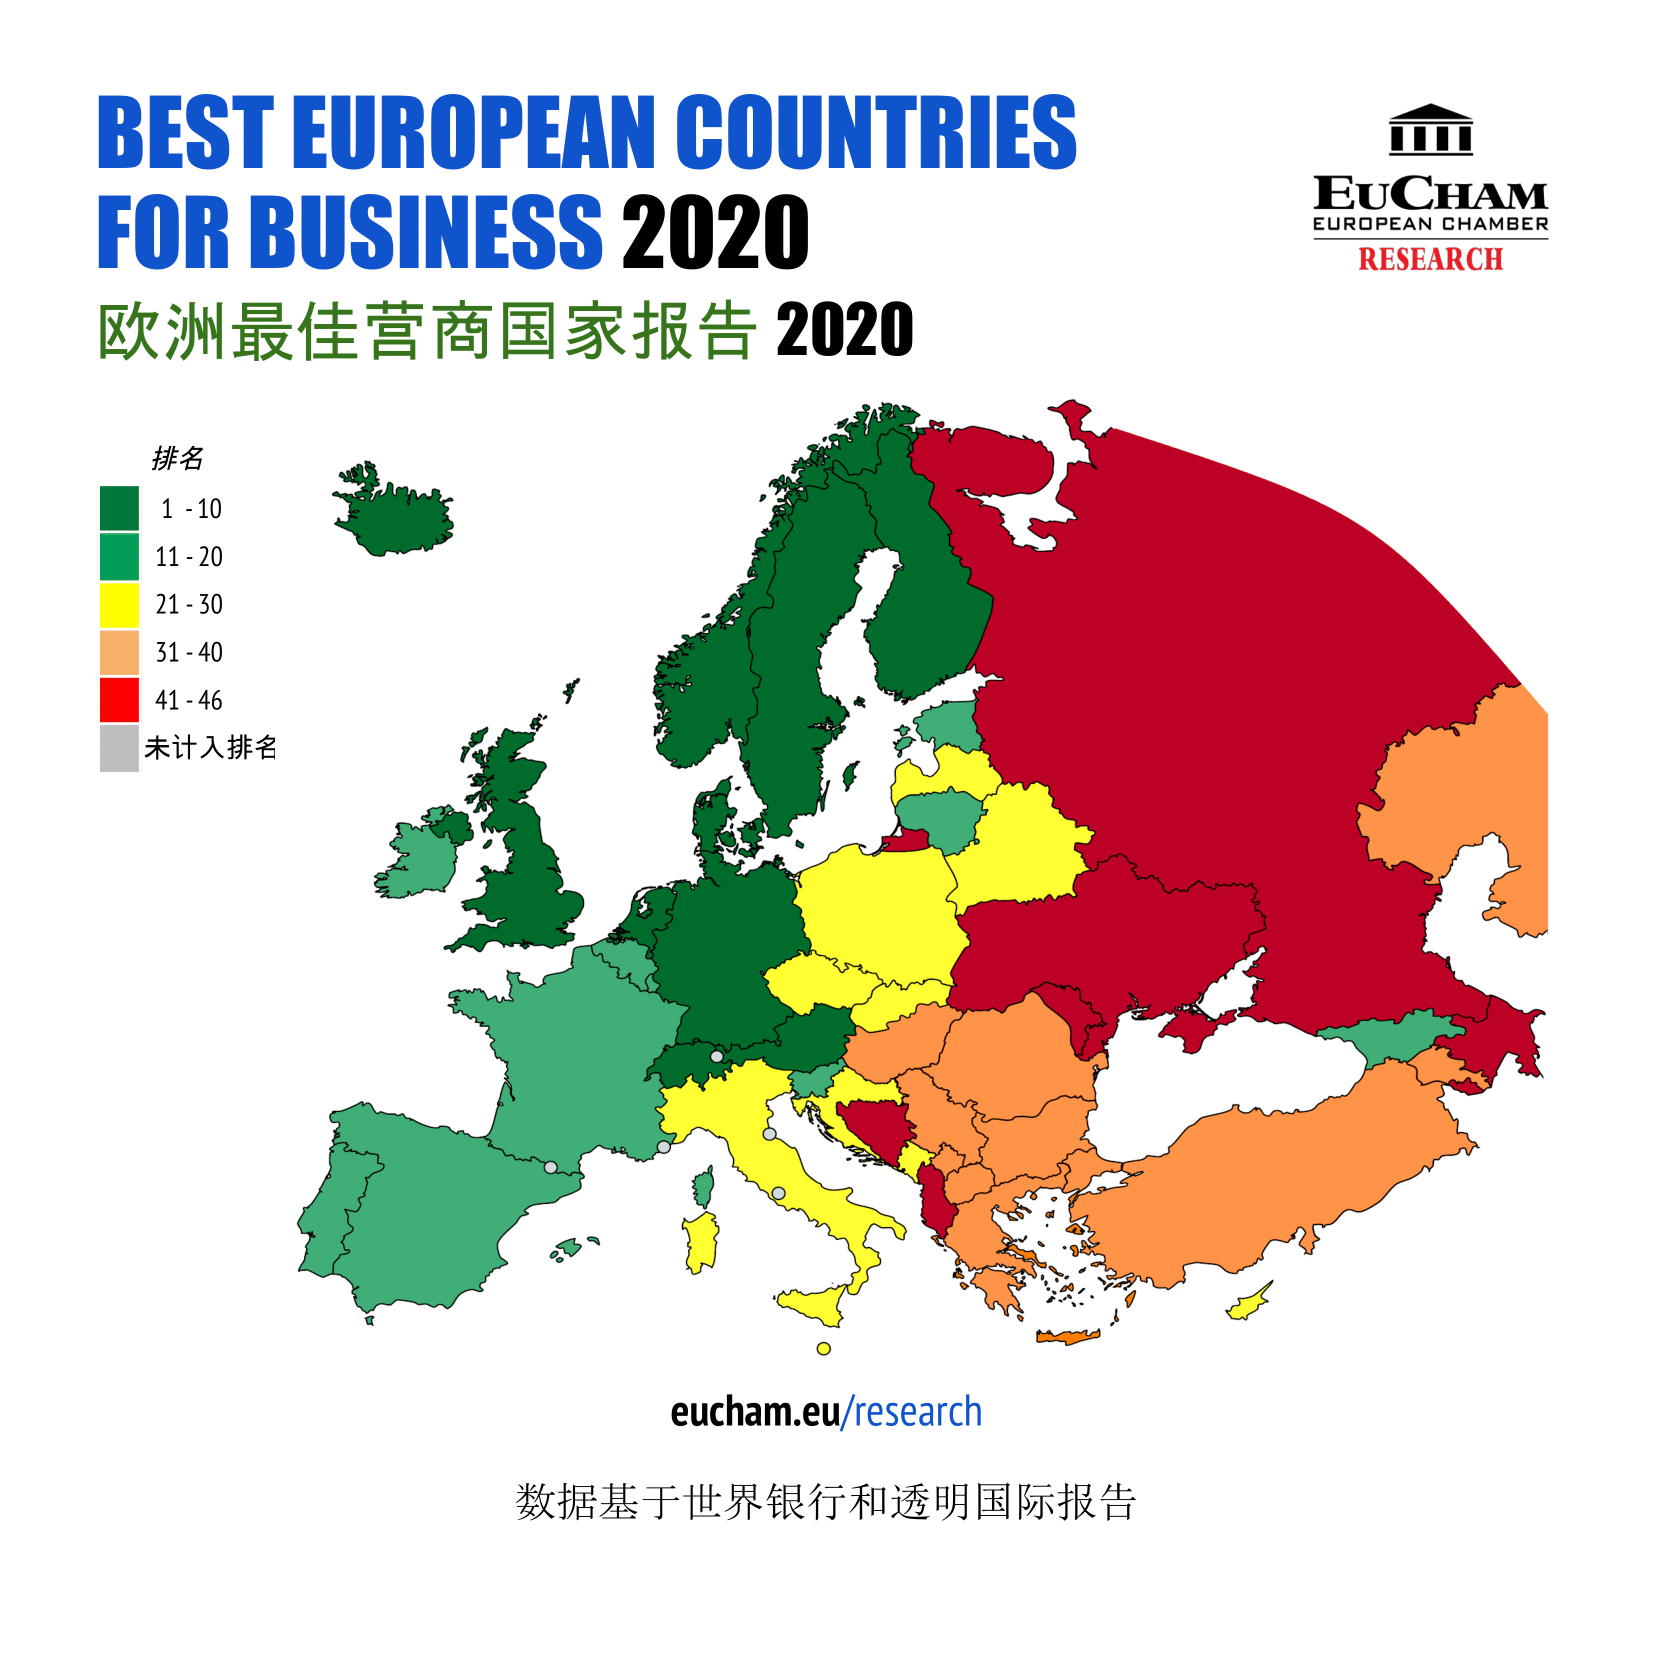
The 2020 edition of the report in which EuCham ranks and analyzes 46 European countries according to their economic environment. The ranking is the result of an analysis based on internationally recognized indexes of the World Bank and Transparency International. EuCham thinks that business integrity and transparency play strategic roles.
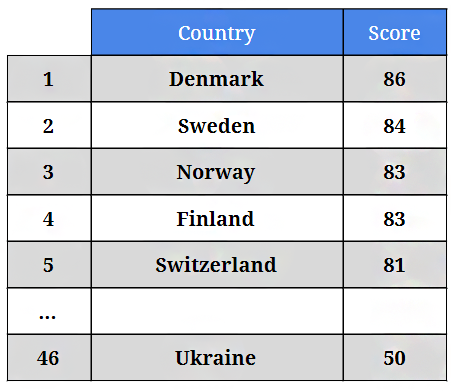
Nordic countries are still on the top of the list: Denmark, Sweden, Norway and Finland, followed by Switzerland, UK and Germany. Estonia, Lithuania and Georgia are outstanding exceptions among the post-Soviet countries. The report reveals also that the highest level of improvement is shown by Armenia.
Download full report PDF (3 pages)
Chinese • Dutch • English • French • Hungarian • Italian • Japanese • Spanish • Turkish • Vietnamese
PRESS KIT: Infographics for press and social media
|
EuCham Research
February 2020
Best European Countries for Business 2020
|
EuCham data based on World Bank and
Transparency International reports.
46 European countries were considered.
-
As in the previous years, Nordic countries are still dominant at the top of the research Best European Countries for Business 2020.
-
In the ranking, Armenia stands out with its whopping 6 positions up, and with Spain, Montenegro, and Azerbaijan, have gone up the most, while North Macedonia has slipped the most (5 positions down).
-
Regarding the score, the highest level of improvement is shown by Armenia and Kazakhstan.
France, North Macedonia, and Albania have the most significant negative variation. -
The EuCham score is based on the average of two indicators: the Ease of Doing Business score (World Bank) and the Corruption Perception Index score (Transparency International).
-
Russia is slightly improving its score, but stays in the same position near the bottom of the list. Ukraine still remains the last as in the previous year.
Other studies, which do not take into consideration corruption, show different results because they only reflect the capacity of countries’ environments to address the corporate sector’s desire to achieve financial results. The World Bank’s score is mostly influenced by the effectiveness of regulations, and by the time it takes to finalize corporate transactions. EuCham, however, considers integrity and transparency expectations equally important factors in the assessment.
Additional information
The EuCham score, used for the ranking, is the average of the EoDB and the CPI scores (50% weight each). A high score indicates the country is favorable to do business in, while low scores refer to the least favorable countries for business.
The EoDB score by the World Bank (from their Doing Business report) measures the gap between the country’s own economic policies and regulations, and the best practice on each indicator across all economies (e.g. starting a business, paying taxes, trading across borders, property registration). The difference is shown on a scale from 0, representing the lowest possible performance, to 100, the highest currently attainable result according to the new standards used since the 2015 edition of the Doing Business report.
The CPI from Transparency International is used to determine how corrupt each country’s public sector is perceived to be, on a scale from 0 (highly corrupt) to 100 (very clean). A low score can be an indication of widespread bribery, lack of punishment for corruption, or a government not responding to social needs.
Best European Countries for Business 2020
The EuCham Score
| Ranking | EuCham score | Doing Business score World Bank |
CPI score Transparency Int. |
||||||
| 2019 | 2020 | Change | 2019 | 2020 | 2019 | 2020 | 2019 | 2020* | |
| Denmark | 1 | 1 | – | 86.32 | 86.15 | 84.64 | 85.30 | 88 | 87 |
| Sweden | 3 | 2 | ↑ | 83.14 | 83.50 | 81.27 | 82.00 | 85 | 85 |
| Norway | 2 | 3 | ↓ | 83.48 | 83.30 | 82.95 | 82.60 | 84 | 84 |
| Finland | 4 | 4 | – | 82.68 | 83.10 | 80.35 | 80.20 | 85 | 86 |
| Switzerland | 6 | 5 | ↑ | 80.35 | 80.80 | 75.69 | 76.60 | 85 | 85 |
| United Kingdom | 5 | 6 | ↓ | 81.33 | 80.25 | 82.65 | 83.50 | 80 | 77 |
| Germany | 7 | 7 | – | 79.45 | 79.85 | 78.90 | 79.70 | 80 | 80 |
| Netherlands | 8 | 8 | – | 79.02 | 79.05 | 76.04 | 76.10 | 82 | 82 |
| Iceland | 9 | 9 | – | 77.68 | 78.50 | 79.35 | 79.00 | 76 | 78 |
| Austria | 10 | 10 | – | 77.29 | 77.85 | 78.57 | 78.70 | 76 | 77 |
| Estonia | 11 | 11 | – | 76.75 | 77.30 | 80.50 | 80.60 | 73 | 74 |
| Ireland | 12 | 12 | – | 75.96 | 76.80 | 78.91 | 79.60 | 73 | 74 |
| Belgium | 15 | 13 | ↑↑ | 74.48 | 75.00 | 73.95 | 75.00 | 75 | 75 |
| Luxembourg | 13 | 14 | ↓ | 75.01 | 74.80 | 69.01 | 69.60 | 81 | 80 |
| France | 14 | 15 | ↓ | 74.65 | 72.90 | 77.29 | 76.80 | 72 | 69 |
| Lithuania | 18 | 16 | ↑↑ | 69.92 | 70.80 | 80.83 | 81.60 | 59 | 60 |
| Spain | 21 | 17 | ↑↑↑↑ | 67.84 | 69.95 | 77.68 | 77.90 | 58 | 62 |
| Georgia | 16 | 18 | ↓↓ | 70.64 | 69.85 | 83.28 | 83.70 | 58 | 56 |
| Portugal | 17 | 19 | ↓↓ | 70.28 | 69.25 | 76.55 | 76.50 | 64 | 62 |
| Slovenia | 22 | 20 | ↑↑ | 67.81 | 68.25 | 75.61 | 76.50 | 60 | 60 |
| Latvia | 19 | 21 | ↓↓ | 68.80 | 68.15 | 79.59 | 80.30 | 58 | 56 |
| Poland | 20 | 22 | ↓↓ | 68.48 | 67.20 | 76.95 | 76.40 | 60 | 58 |
| Czech Republic | 23 | 23 | – | 67.55 | 66.15 | 76.10 | 76.30 | 59 | 56 |
| Cyprus | 24 | 24 | – | 65.36 | 65.70 | 71.71 | 73.40 | 59 | 58 |
| Italy | 26 | 25 | ↑ | 62.28 | 62.95 | 72.56 | 72.90 | 52 | 53 |
| Slovakia | 25 | 26 | ↓↓ | 62.59 | 62.80 | 75.17 | 75.60 | 50 | 50 |
| Croatia | 29 | 27 | ↑↑ | 59.70 | 60.30 | 71.40 | 73.60 | 48 | 47 |
| Malta | 28 | 28 | – | 59.72 | 60.05 | 65.43 | 66.10 | 54 | 54 |
| Belarus | 27 | 29 | ↓↓ | 59.89 | 59.65 | 75.77 | 74.30 | 44 | 45 |
| Montenegro | 33 | 30 | ↑↑↑ | 58.87 | 59.40 | 72.73 | 73.80 | 45 | 45 |
| Hungary | 32 | 31 | ↑ | 59.14 | 58.70 | 72.28 | 73.40 | 46 | 44 |
| Romania | 30 | 32 | ↓↓ | 59.65 | 58.65 | 72.30 | 73.30 | 47 | 44 |
| Armenia | 39 | 33 | ↑↑↑↑↑↑ | 55.19 | 58.25 | 75.37 | 74.50 | 35 | 42 |
| Greece | 36 | 34 | ↑↑ | 56.54 | 58.20 | 68.08 | 68.40 | 45 | 48 |
| Turkey | 34 | 35 | ↓ | 57.67 | 57.90 | 74.33 | 76.80 | 41 | 39 |
| North Macedonia | 31 | 36 | ↓↓↓↓↓ | 59.28 | 57.85 | 81.55 | 80.70 | 37 | 35 |
| Bulgaria | 35 | 37 | ↓↓ | 56.62 | 57.50 | 71.24 | 72.00 | 42 | 43 |
| Serbia | 37 | 38 | ↓↓ | 56.25 | 57.35 | 73.49 | 75.70 | 39 | 39 |
| Kazakhstan | 40 | 39 | ↑ | 54.45 | 56.80 | 77.89 | 79.60 | 31 | 34 |
| Kosovo | 38 | 40 | ↓↓ | 55.58 | 54.60 | 74.15 | 73.20 | 37 | 36 |
| Azerbaijan | 44 | 41 | ↑↑↑ | 51.82 | 53.35 | 78.64 | 76.70 | 25 | 30 |
| Moldova | 41 | 42 | ↓ | 53.27 | 53.20 | 73.54 | 74.40 | 33 | 32 |
| Russia | 43 | 43 | – | 52.69 | 53.10 | 77.37 | 78.20 | 28 | 28 |
| Albania | 42 | 44 | ↓↓ | 52.76 | 51.35 | 69.51 | 67.70 | 36 | 35 |
| Bosnia & Herz. | 45 | 45 | – | 50.91 | 50.70 | 63.82 | 65.40 | 38 | 36 |
| Ukraine | 46 | 46 | – | 50.13 | 50.10 | 68.25 | 70.20 | 32 | 30 |
* This column, named 2020, uses data from CPI 2019 published in Jan 2020. Same logic for the column named 2019.
No data: Andorra, Liechtenstein, Monaco, Vatican City, San Marino.
Sources: World Bank, Transparency International, EuCham – European Chamber.
EuCham Research Department: Rania Fallatah, Cecilia Bottoni, Patrícia Lipi.
Editing: Lanxin Sun, Elifnur Bingöl, Patricia Lojo Fernandez.
| Download full report in other languages | Infographics | ||||
| Language | Full report | Horiz. | Vert. | Square 1 | Square 2 |
| Chinese | PNG | PNG | PNG | PNG | |
| Dutch – Nederlands | PNG | PNG | |||
| English | PNG | PNG | PNG | PNG | |
| French | PNG | PNG | |||
| Hungarian | PNG | PNG | PNG | PNG | |
| Italiano | PNG | PNG | PNG | PNG | |
| Japanese | PNG | PNG | |||
| Spanish | PNG | PNG | |||
| Turkish | |||||
| Vietnam | PNG | PNG | |||